On January 15th 2022 at 15:10 AEDT (04:10 GMT) the Hunga Tonga Hunga Ha’apai underwater volcano near Tonga erupted. Hunga Tonga-Hunga Ha’apai is 1.8 kilometres tall and 20 kilometres wide, but most of it is underwater, with the top 100 metres visible above sea level. The pressure wave generated by the explosion blasted through the atmosphere at more than 1000 kilometres per hour.
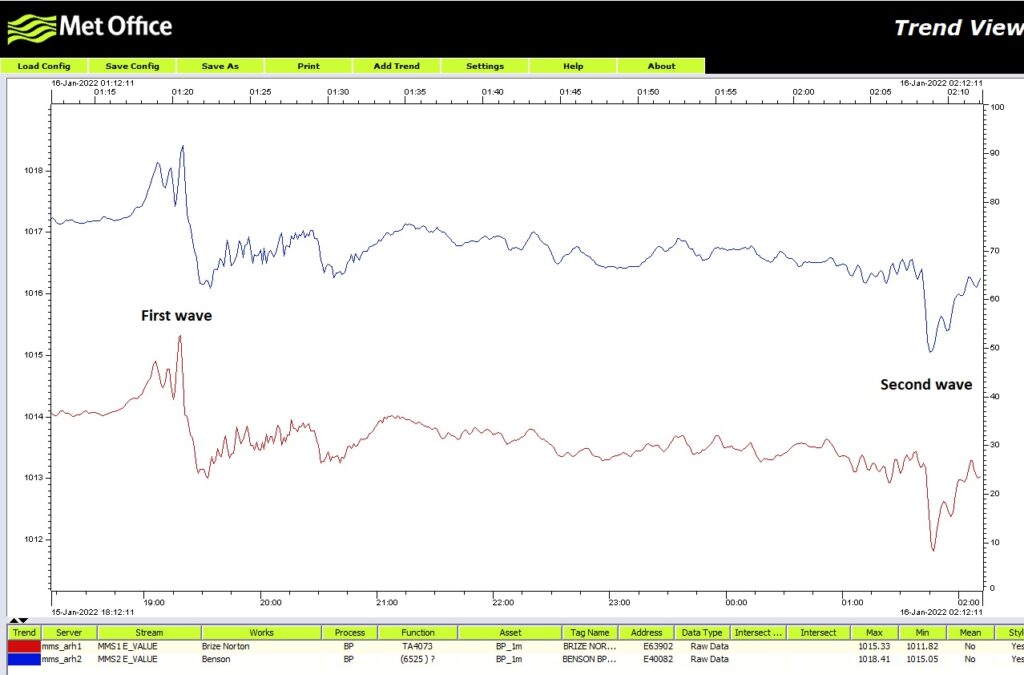
Dave mentioned to me that the people had registered a pressure increase on their monitoring devices due to the pressure wave and checking the internet the Met Office has issued a nice graph on Twitter.
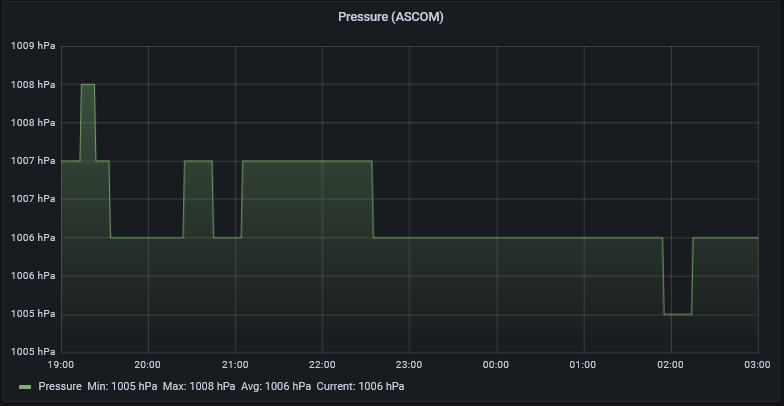
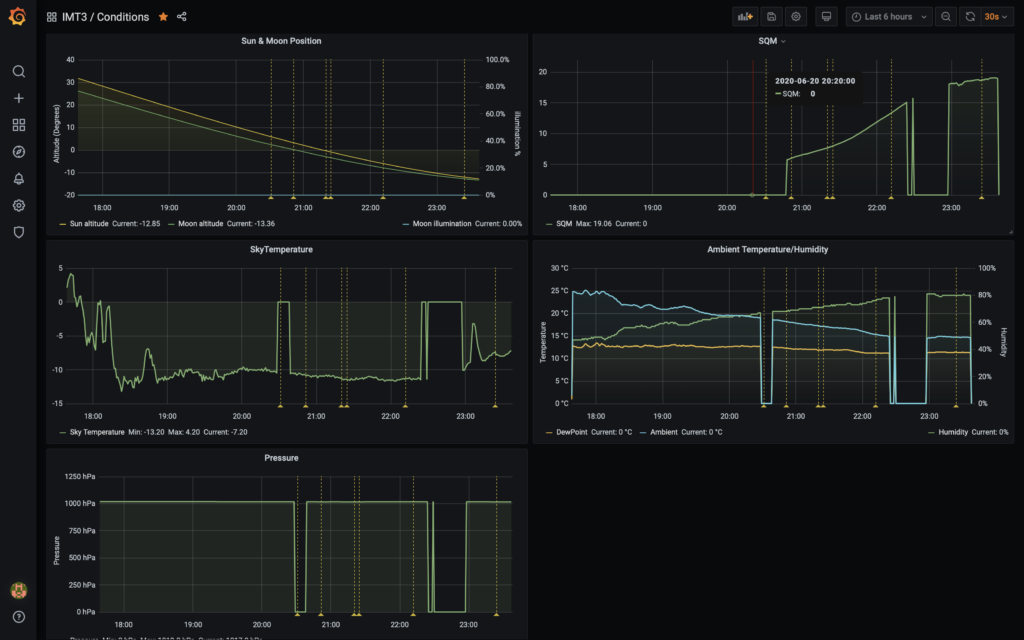
On the observatory Grafana dashboard I could indeed see two pressure waves at the correct time. We only record the pressure every 60 seconds because for astronomy that’s all we need so we do not have the resolution of others but the height of the two events are in the correct range compared to the graph above.
Double pressure wave
The first pressure wave arrived (19:13-19:24) we was 2hPa increase as we have lost some resolution due to sampling period and the Met Office is ~2.5 hPa. We could change the sampling to be lower (15 or 30 secs) as storage is not an issue and then we would have caught a nice defined peak. The second pressure wave (2022/1/16 01:55-2:14) and we measured ~1hPa drop and again was lower than the Met Office due to our sampling period.
Our auxiliary pressure monitoring install was down during this period as the box appeared to have been restarted/rebooted and the ASCOM Alpaca instance was not running which was unfortunate 🙁
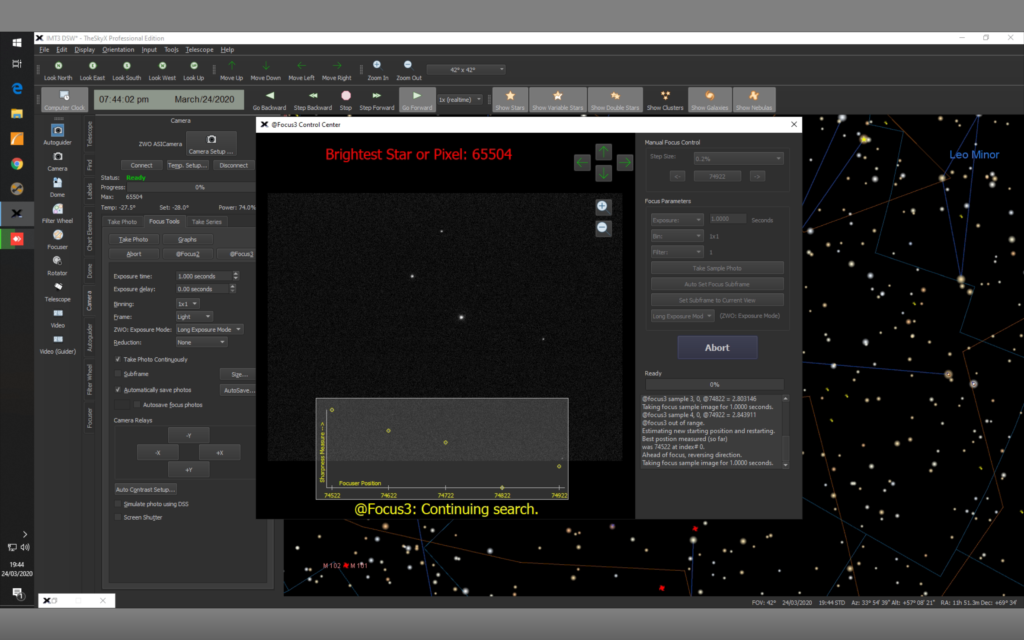
Session period 21:00 – 23:57, transit start ~21:16 and end ~00:05
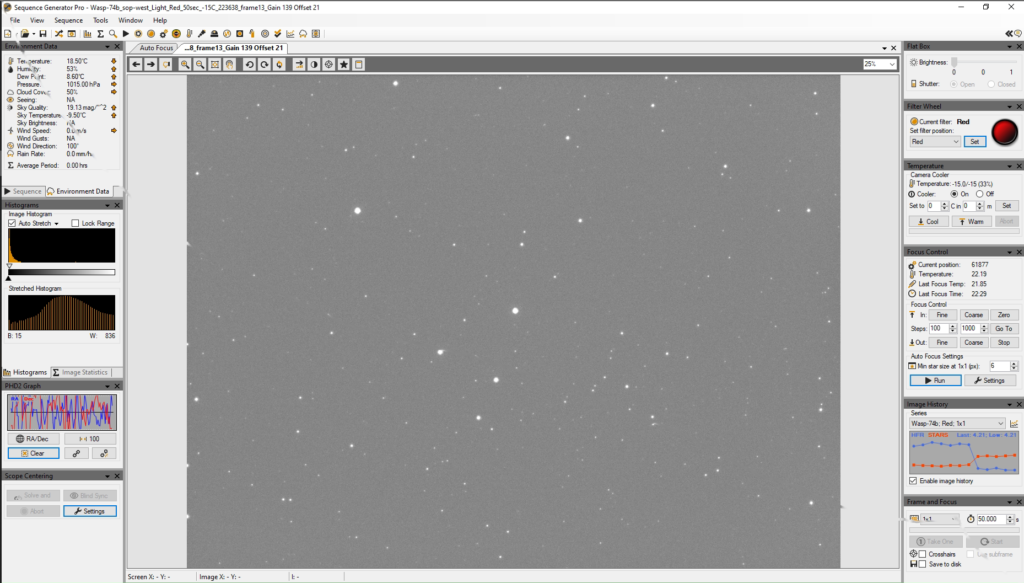
Started with Lum autofocus at 21:17 but on changing to the Red filter the HFR rose to 8.5 so refocused on Red at 21:20, position 60789, HFR 3.97 at 21℃. The change in HFR was more likely the warm sky and seeing conditions.
Restarted imaging at 21:39 at new Gain 10 and Offset 10 with a 15 second exposure to get the exposure down well below the 65k max to around 35k. The target star is a magnitude +7.69 so the initial Gain 139 Offset 21 and even Gain 75 Offset 12 were too high even at 10 seconds exposure.
We started with no delay in between the exposures until the start of the transit, then decided due to the large amount of data (35GB) being collected we should put a delay in which we did of 60 seconds. In hindsight we should be placed a smaller delay period in 15-30 seconds to allow us to gather more data points for the transit period. We have emailed the ESA team to start a conversation on planning exposure/delay settings for transits.
We then finished was forced to finish before the projected transit was completed when the clouds rolled in, and took Dark, Bias and Flats frame at Gain 10, Offset 10 ready for the analysis software.
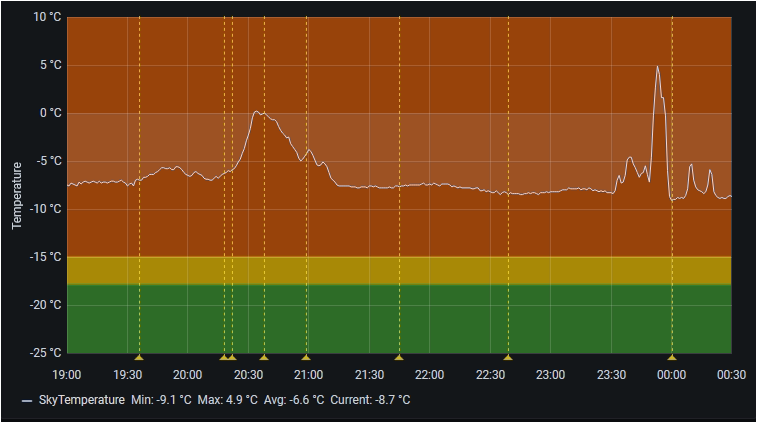
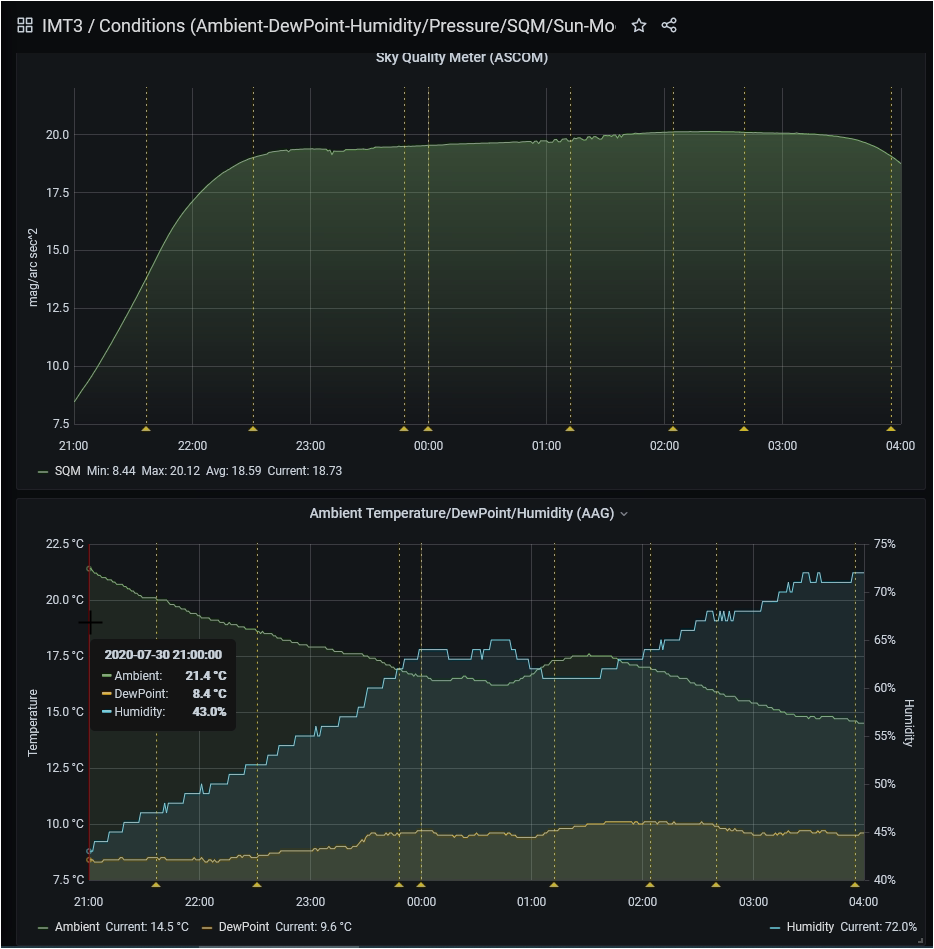
After reviewing the data and the monitoring graphs it is obvious that the less than desirable Sky Temperature showed it was not truly clear. Below is the effect of high haze and cloud passing across the sky during our observation session. It should be noted that we have not had sky with a reading <= -18℃ since mid July.
Not a truly clear sky during the transit
How much impact this has on the observation and measurements we will discuss with the Exoplanet team.
Started around 21:15, Guiding by 22:02, Capture started 22:22, Finished at 03:31.
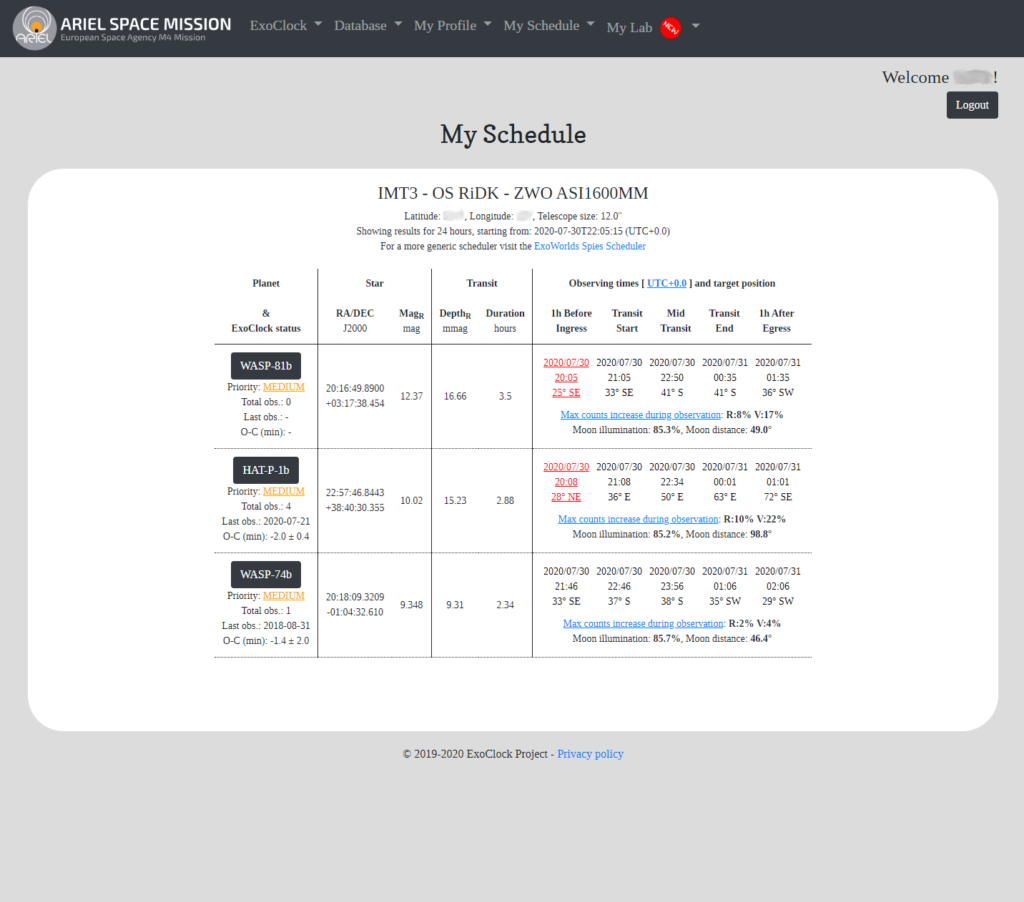
Dave and I are part of the amateur exoplanet monitoring effort for the ESA Ariel mission. We decided that we would allocate some time to try and provide observing data towards the project whenever we could.
Part of this requires some forward planning such as looking at the upcoming transit visible and their associated time. This is due to the altitude of the object, the ingress and the egress times of the projected transit.
Prior to this we had discussed in advance which object to target for the chosen evening. All the hard work of choosing objects is done by the Exospies project website as they list the candidates they need data for via a schedule. So it’s a simple task for use to go through the list and work out what fits best for us.
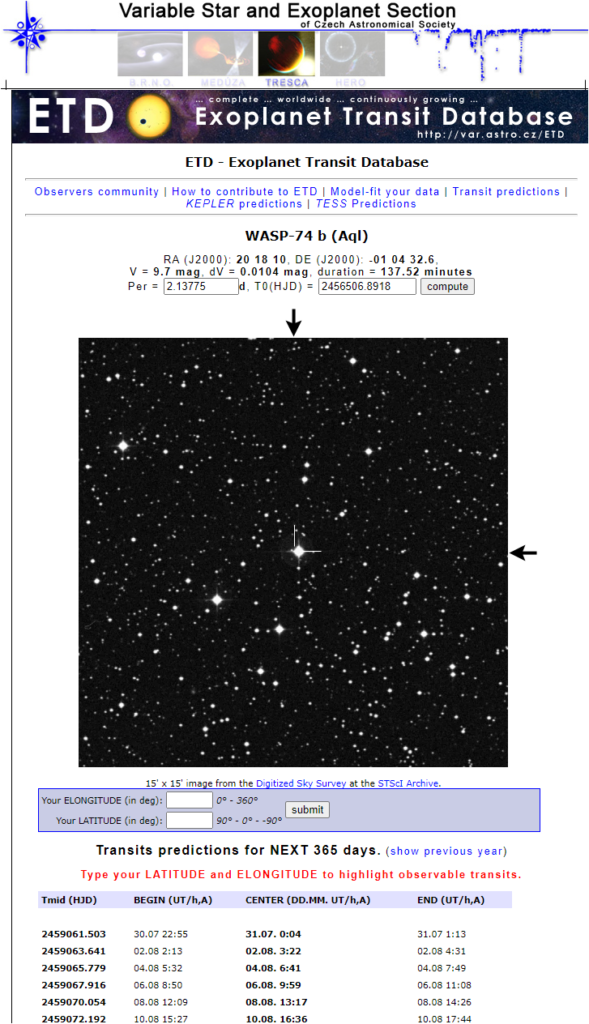
Unfortunately whilst opening the dome to cool down I decided to review the schedule but I was hit with a server 500 error from the website. In a panic that I might miss the start of the event I scoured the internet for alternate exoplanet transit time websites and found the excellent Exoplanet Transit Database of the Czech Astronomical Society.
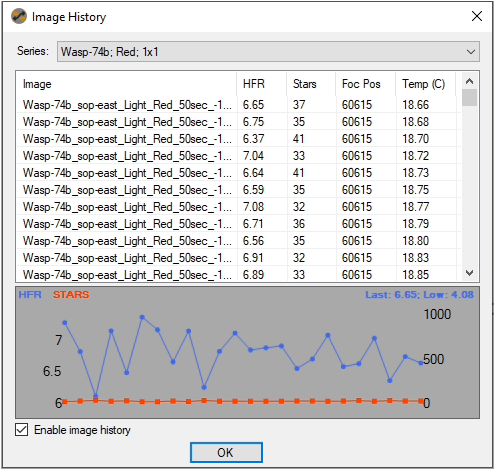
I had issues with focus drift all night due to the temperature fluctuations but at a recent Zoom session it was discussed that images can be out of focus with no detrimental effect on the measurements :
SGPro Image History
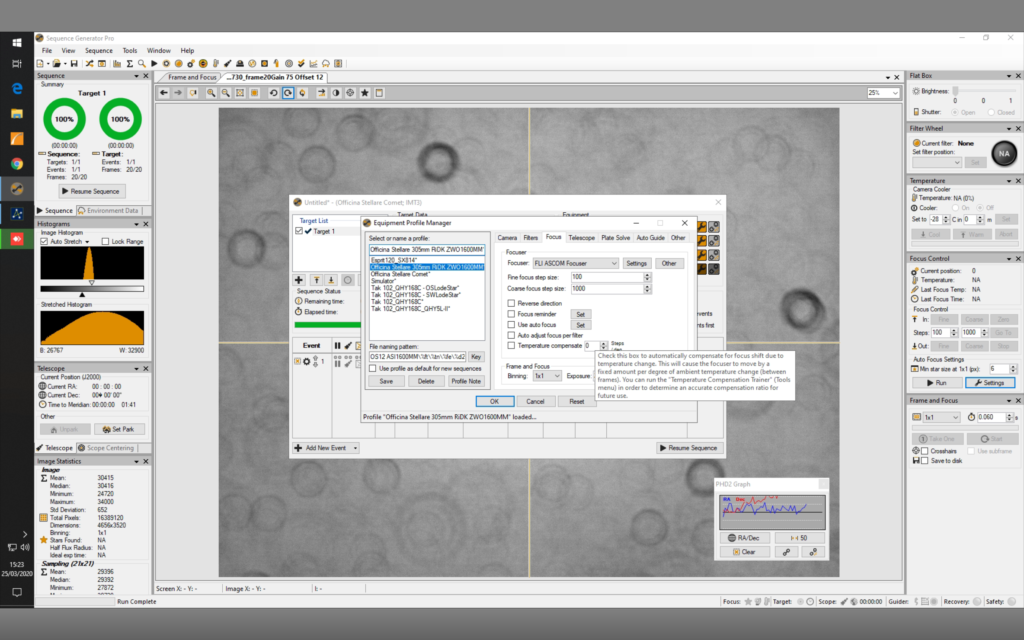
I was unable to auto focus successfully maybe due to the low altitude and seeing. I also discovered that temperature compensation was enabled so we probably need to remeasure the temperature compensation coefficients so the focus deltas are better between the par focal filters.
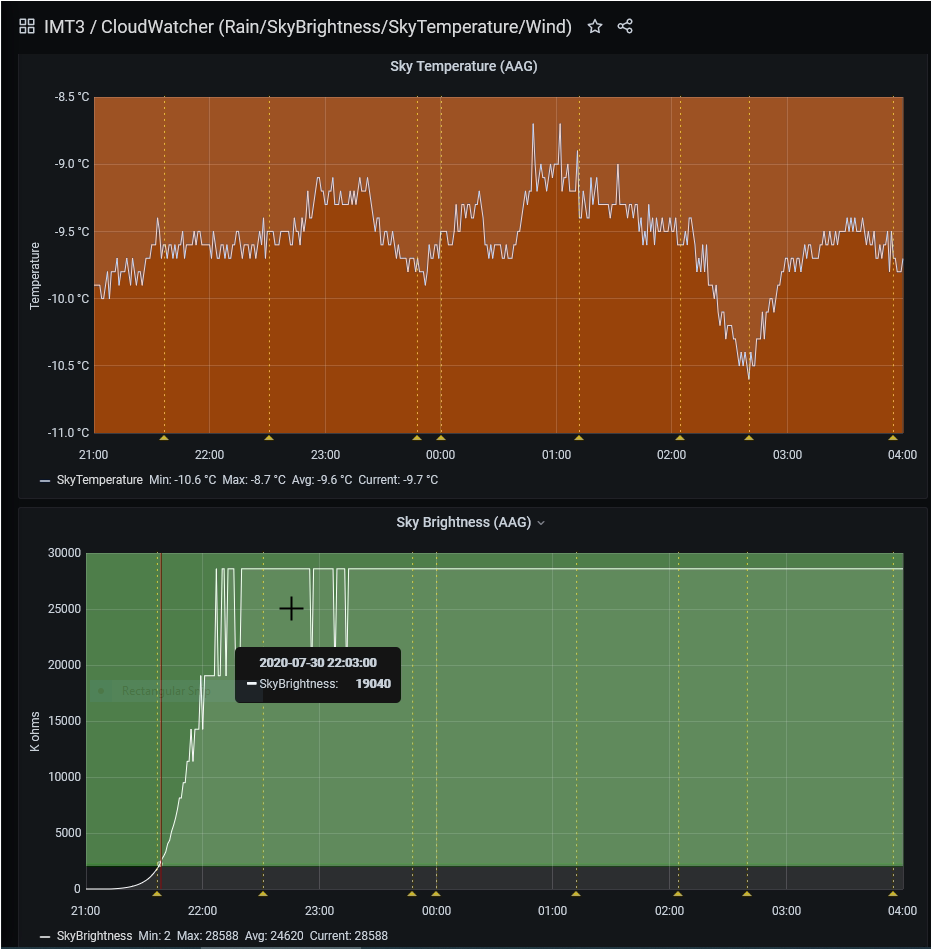
The object was at a relative low altitude, the outside temperature was warm and although the skies appeared clear our AAG CloudWatcher sensors via the Grafana dashboard told a different story. For us a truly clear sky is anything equal or lower than -18℃.
Sky Temperature – it was clear but it wasn’t !
Sky Temperature – T’was warm !
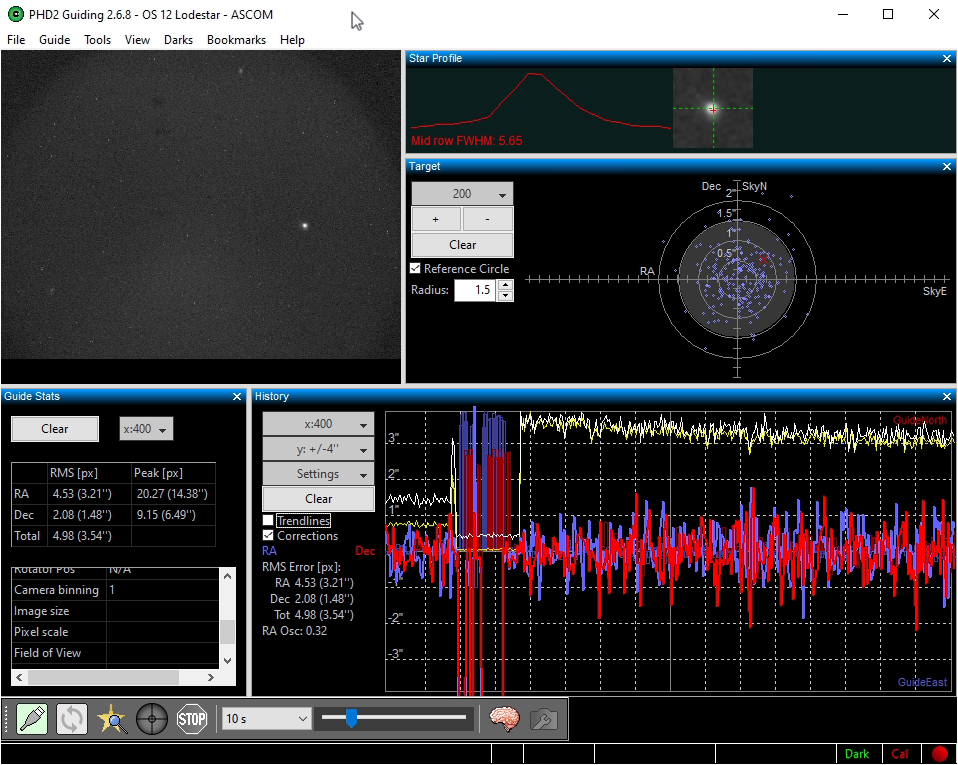
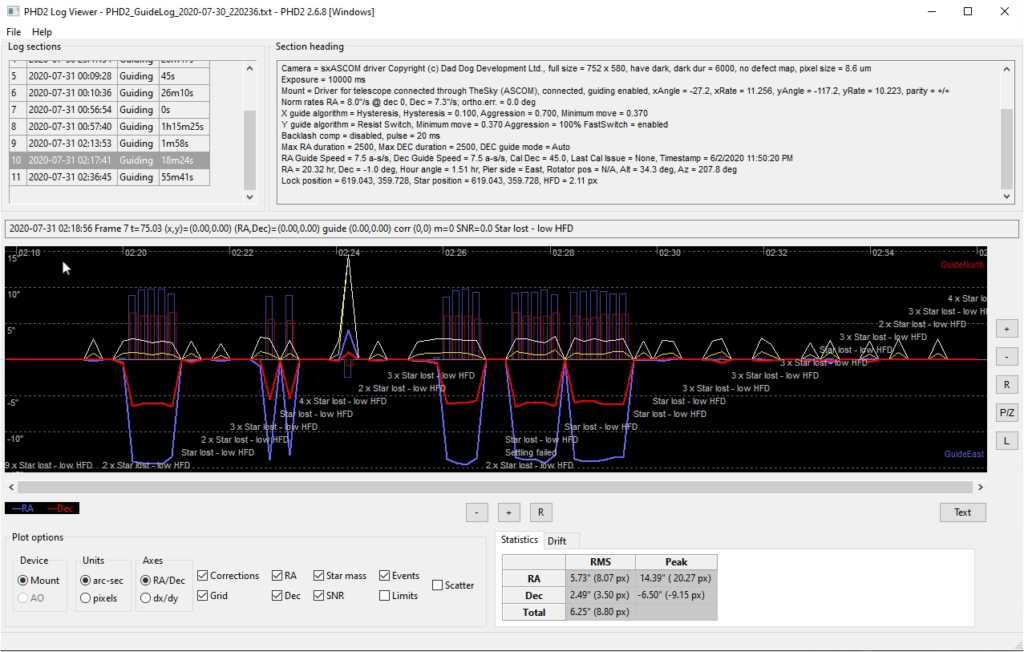
After performing a meridian flip, resumed the guiding I started to feel tired so I set my alarm for 3am and went to bed. Unfortunately there appeared to be a guiding issue at some point shortly I went to bed.
Guiding issues shortly after meridian flip
This was investigated using the phdLogViewer and shown to be a loss of guide star and didn’t recover for around 18 minutes.
The guiding issue also caused the image to shift so the target and reference stars moved. We need this in frame in order to run the frames through the provided HOPs data analysis program which hopefully won’t have a problem in reading them. That’s an exercise for this weekend and hopefully we will have enough data to yield a decent light curve that we can submit.
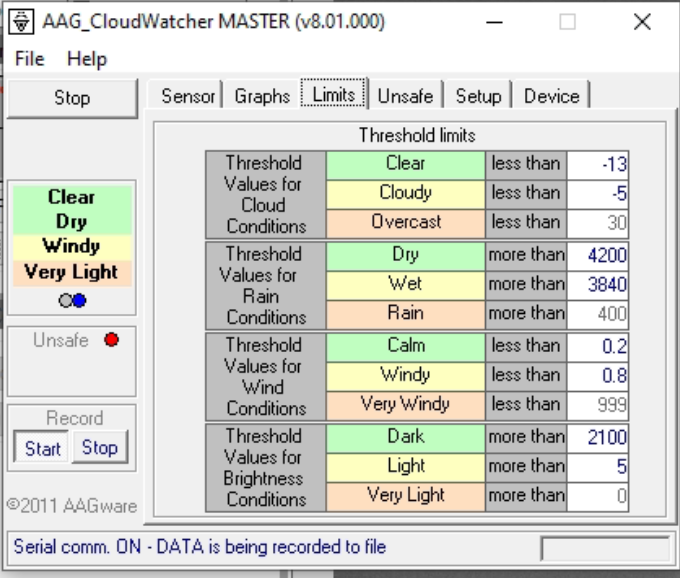
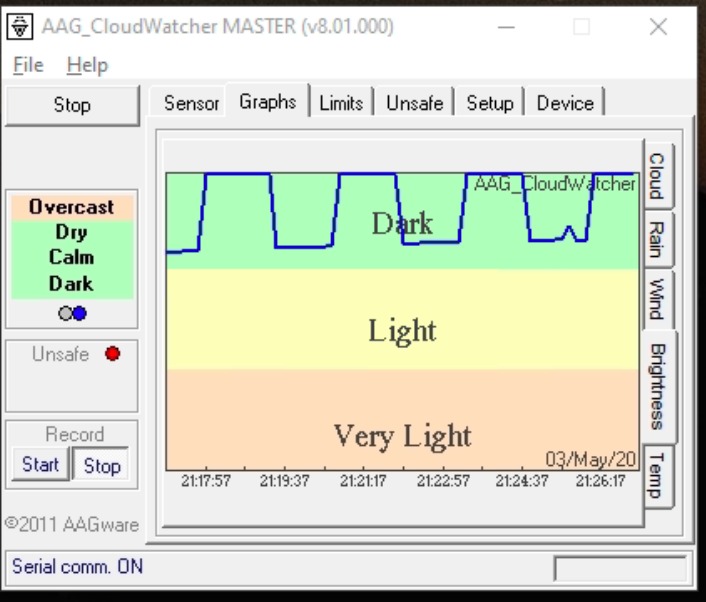
Tonight GingerGeek came over for a bit of social distancing friendly astronomy along with a bottle of Malbec wine. The idea was to calibrate the AAG, specifically when it goes from Very Bright to Light to Dark and at those points what the SQM value is along with the Sun’s position below the horizon. The AAG needs to get to 2100 which is dark, light is 5 and very light is 0.
The first time we noticed the values starting to change on the AAG brightness when it moved from its continuous reading throughout the day was at 21:47 when the Sun was -3.45 degrees below the horizon and the SQM was 10.15.
Within seconds the AAG read 9 and was already on Light vs Very Light and the Sun was now -3.54 degrees below the horizon and the SQM read 10.28.
It took almost half an hour for the AAG to get to dark. At 22:16 the AAG finally reached 2100, the SQM was at 13.97 and Sun was at -6.52 degrees below the horizon.
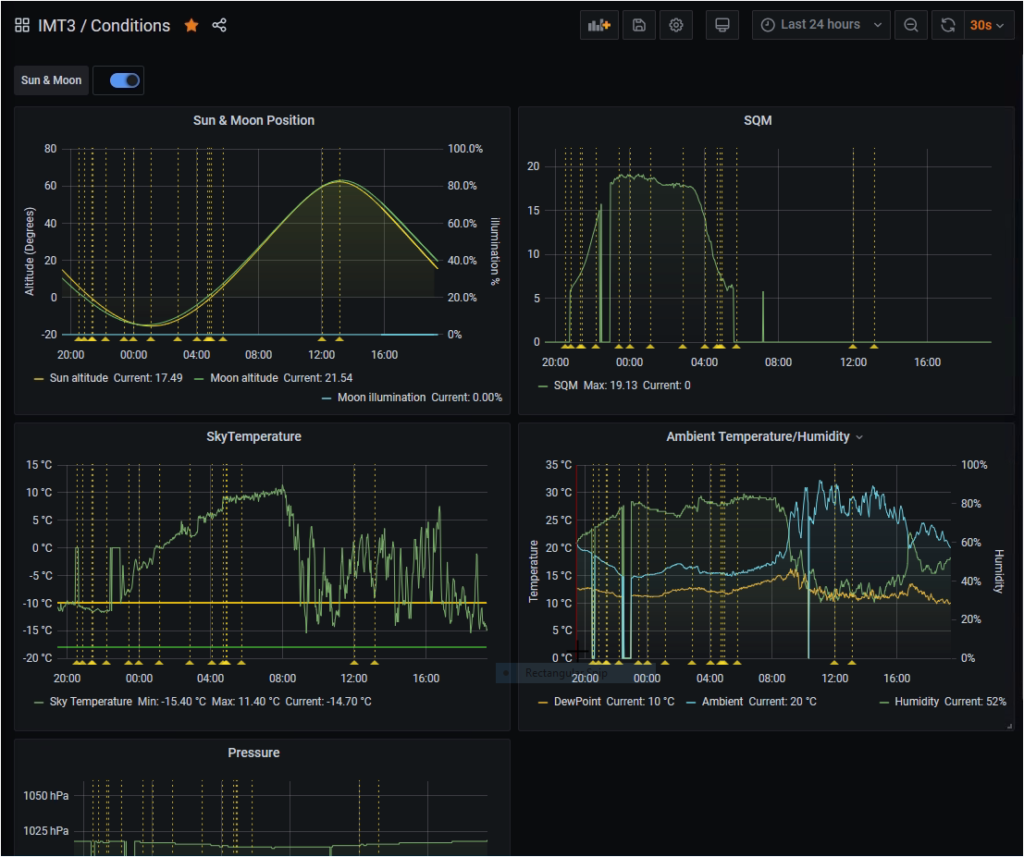
GingerGeek had also developed a new server for IMT3 to visualise some of the data from the observatory. The Grafana dashboard charts below show the data along with the Sun altitude.
New IMT3 Grafana dashboard
Looking at the last 24 hours shows the effect of the light nights on the SQM. The raised values after 4am went the value should be reducing or zero is the effect of a cat or bird covering the sensor. Also worthy of note is the sky temperature which shows the effect of cloud as the SkyTemperature increases. A truly clear sky would yield a value of -18℃ or better.
Shows the entire night
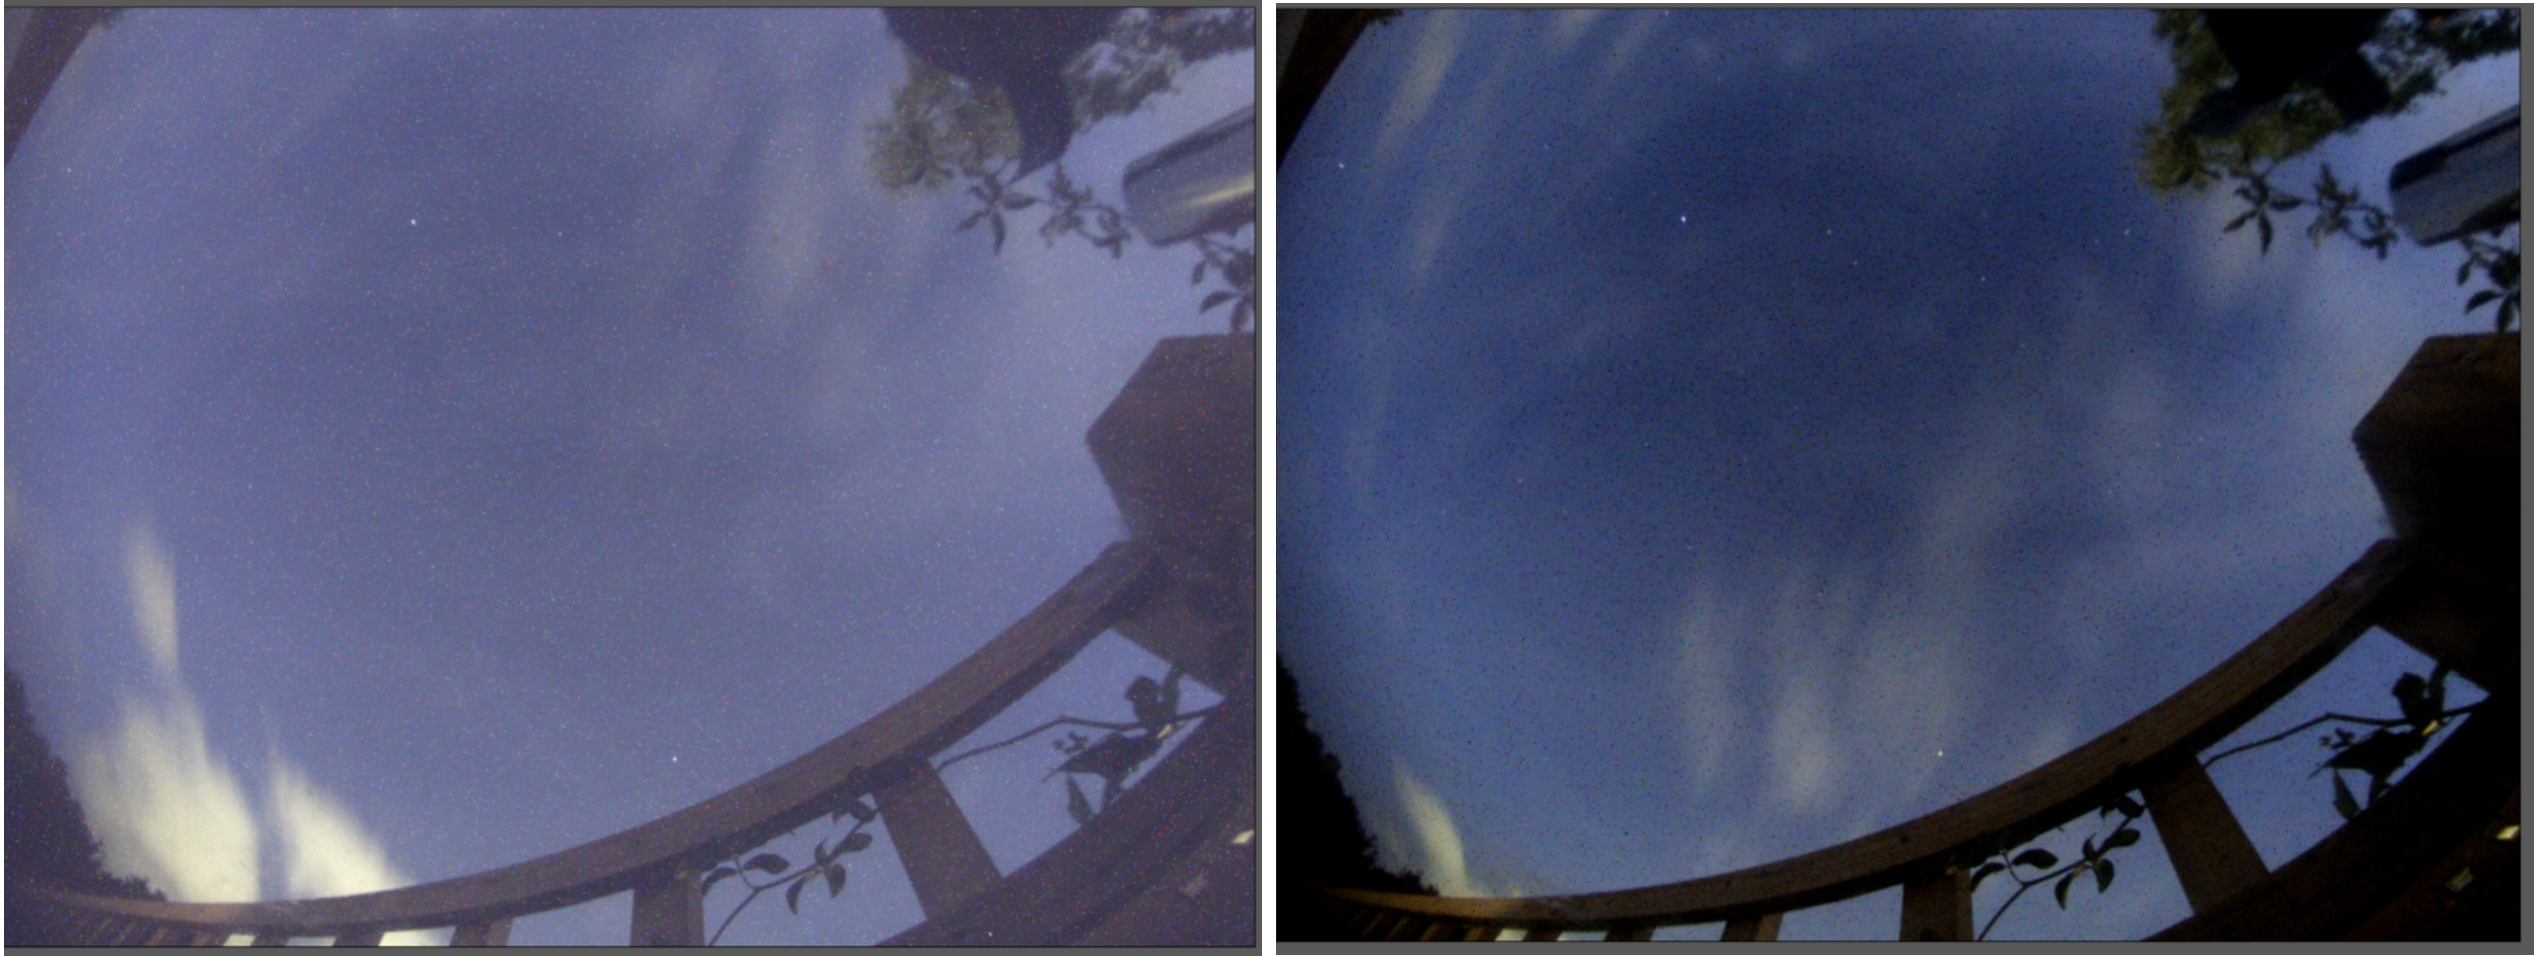
We also took darks on the ASC and applied them since we had never bothered to do it before. The shot below shows the before and after effect of applying the dark/bad pixel map. The whole image looks a lot cleaner and darker, although there seems to be some negative representation going on with dark pixels.
Before and after applying darks
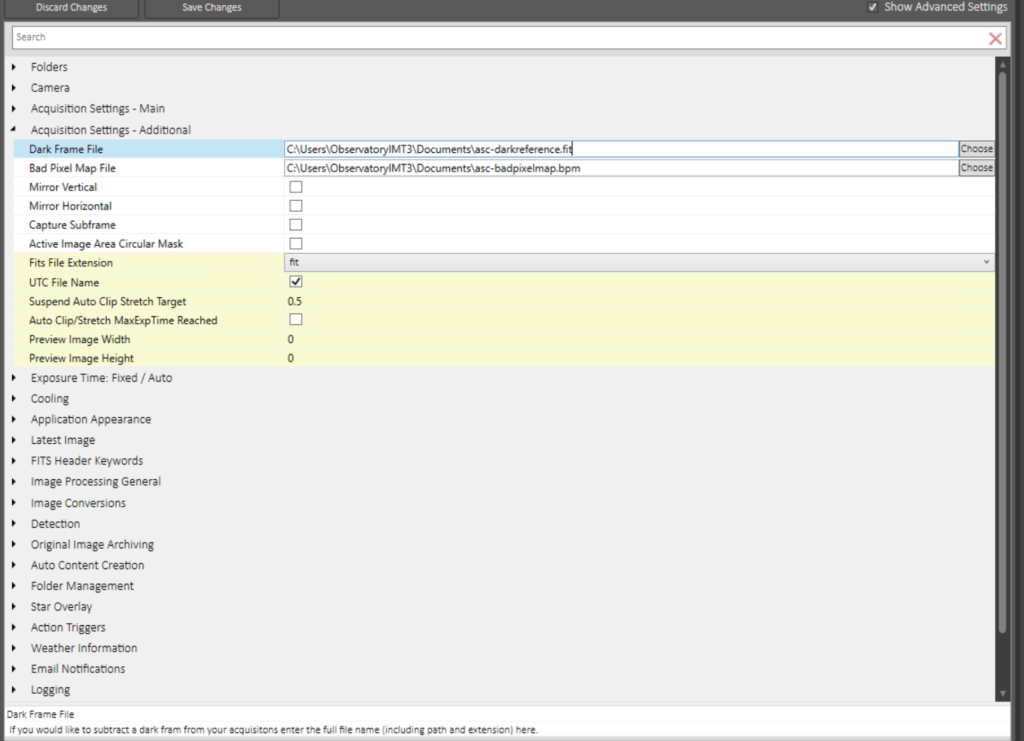
The setting that needed to be changed in the ASC software took GingerGeek a while to find.
ASC Setting to apply darks
During the daytime the ASC looked awful but remote the darkframe reference file and just applying the badpixel map seem to be better. Tonight’s set of images will show if this is better or not.
The only other odd thing that happened tonight was the dome closed without the safety setting it off. Not sure why yet ……
Today has been wet, windy and cloudy, which for once is a blessing! Why I hear you ask? Well simply put, to calibrate the hell out of the AAG one needs inclement weather and today has provided that in spades 🙂
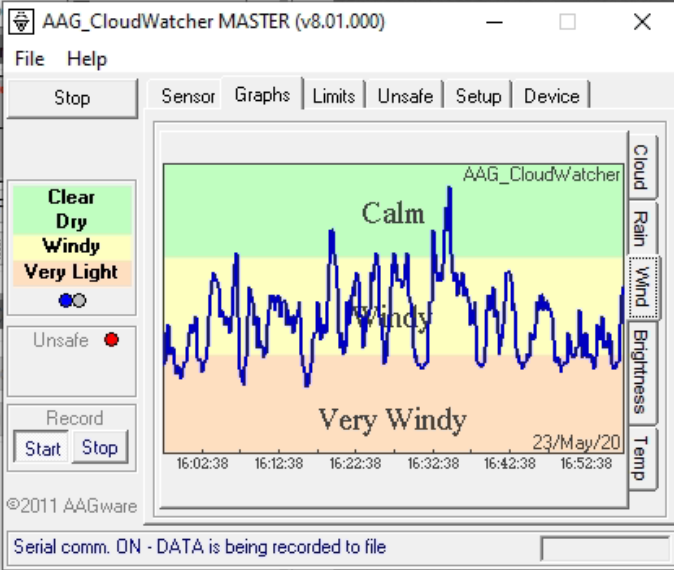
So after monitoring the AAG all day here are the final settings. I have changed the limits for the wind only today, but I have extended the time period for the graph from 10mins to 1 hour. The wind has recorded over 1.1 m/s which may not seem a lot but at times has blown garden furniture around and the bins.
We recently decided to replace our existing weather station with one that had better ASCOM integration. I had previously looked at the AAG CloudWatcher but at the time felt it offered more than we need but that turned out to not be the correct choice.
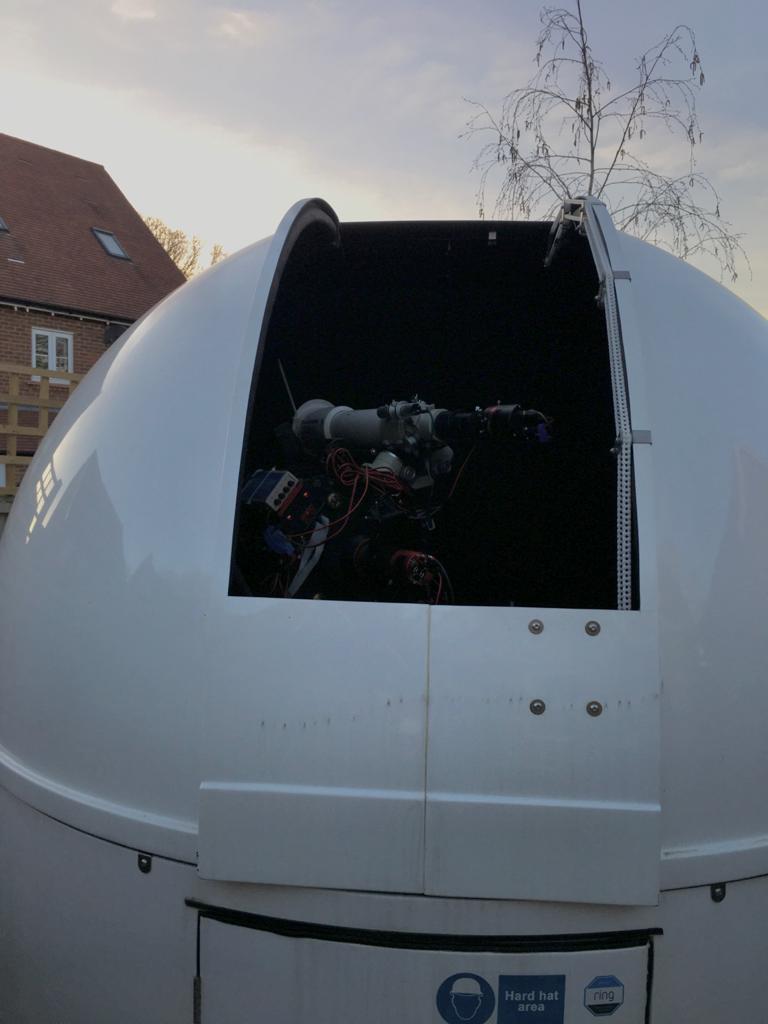
We ordered the AAG with an internal humidity sensor, the optional anemometer, mounting kit and 10 meter communications cable. Due to the ongoing human malware situation it took two weeks for it to arrive from Spain and was delivered to the IMT3 chief TOSA.
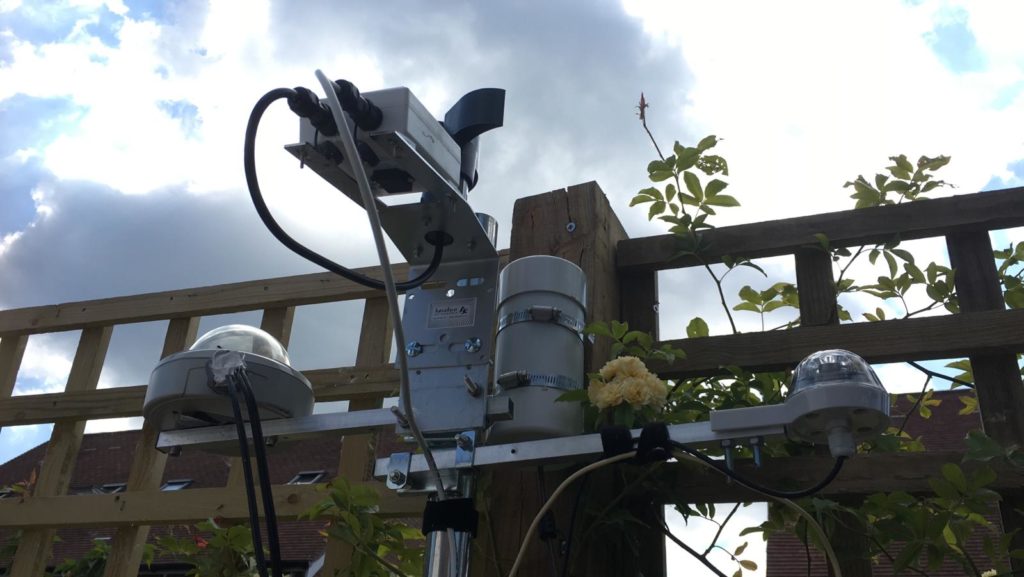
Once the new PSU arrived the Chief TOSA then set about removing the existing weather station and installing the AAG cloudwatcher.
All Sky Camera, AAG CloudWatcher, Unihedron SQM and another rain sensor
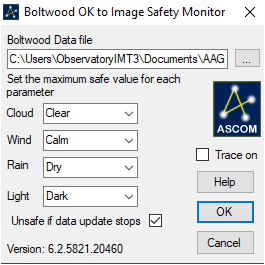
This also meant connecting the safety relay circuit wires to the Pulsar Dome, installing the AAG software, downloading the ASCOM boltwood driver and configuring SGPro. Within SGPro we have set the safety status set to be “OK to image” where the required conditions are more stringent than the conditions for the dome to open. The reason being that we want the dome to open as the light begins fade and allow the scopes to cool down but not be okay to image until it is dark.
On the first night of operation we ran into a problem. Unlike the other sensor readings and graphs we would see the temperature and cloud readings have an expected shape but the sky brightness sensors kept going up and down at a regular interval then gave the graph a saw-tooth shape.
Unfortunately this resulted in the safety status going on and off until we overrode it. We sent a quick email to Lunatico reporting the symptoms and asking for advice. It didn’t take long for Jaime to reply informing us that another customer reported the same issue and asked for a few days to investigate.
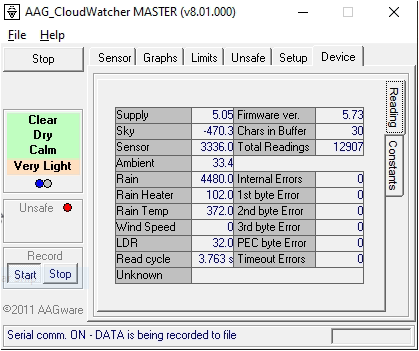
Good to his word we received an email from Jaime explaining the issue and asking if we could perform a firmware upgrade. Now due to the current lockdown restrictions this meant that I had to co-ordinate over the phone with the resident Chief TOSA to physically disconnect and reconnect the power whilst I remotely set the firmware update. The initial issues encountered were due to PEBCAK (Problem Exists Between Chair And Keyboard) as I had not read the documentation correctly !
New Firmware 5.73 loaded
That evening we watched and the Sky Brightness line graph was now as expected and not looking like a cog shaped wheel. Well done Jaime@Lunatico.es for the quick response and fix, Chief TOSA was a happy dome dwarf again and that’s what counts !
At the moment we are trying to get the cloud sensor to be more accurate to what we visually observe, this is an ongoing effort. We decided to record the AAG Sky Brightness sensor readings at various times and compare with our SQM readings :
Event
SQM
AAG Brightness Value
Civil Darkness
13.08
949
Chief TOSA setting OK to open
13.89
2100
Nautical Darkness
18.92
28588
Astronomical Darkness
19.03
28588
Using the above values it looks like we could reduce our chosen threshold level of 2100 to 1000 in order to allow the dome to open and the scopes to cool down. The Sky Brightness does not appear to change beyond Nautical Darkness. We are now investigating the correct value for the early morning from the AAG logs. This is so we know what the Sky Brightness value should be at which to stop imaging and close the dome in the early morning when unattended.
We still have at lot to configure and read up about using the AAG CloudWatcher but at the moment our initial experience is a positive one. Obviously we will be chatting to Lunatico about our level settings and make some suggestions regarding the software.
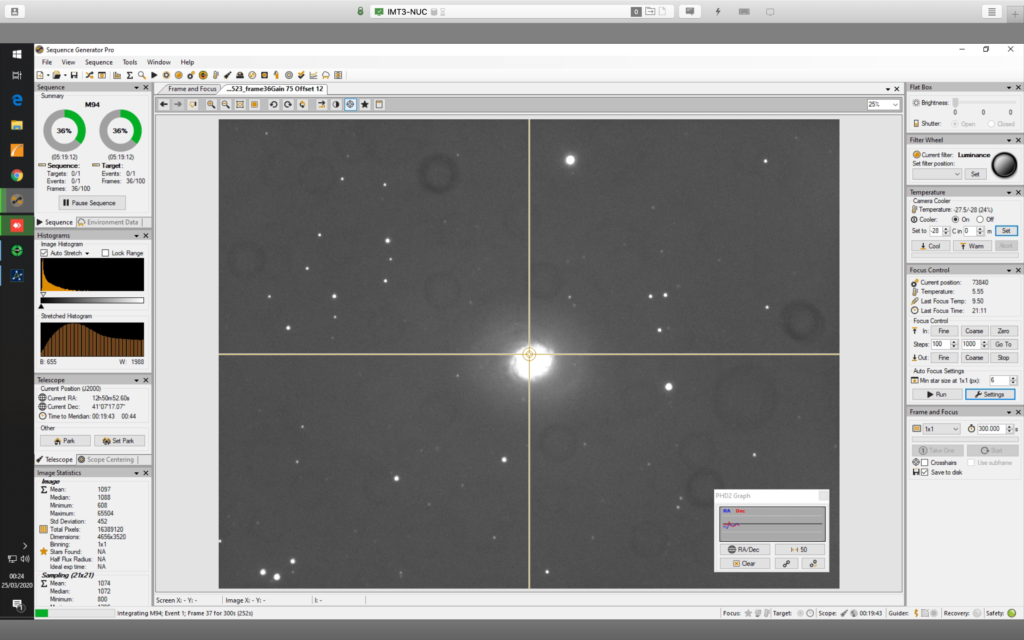
Tonight I plan on setting the 12″ imaging M94, a Messier galaxy in Canes Venatici.
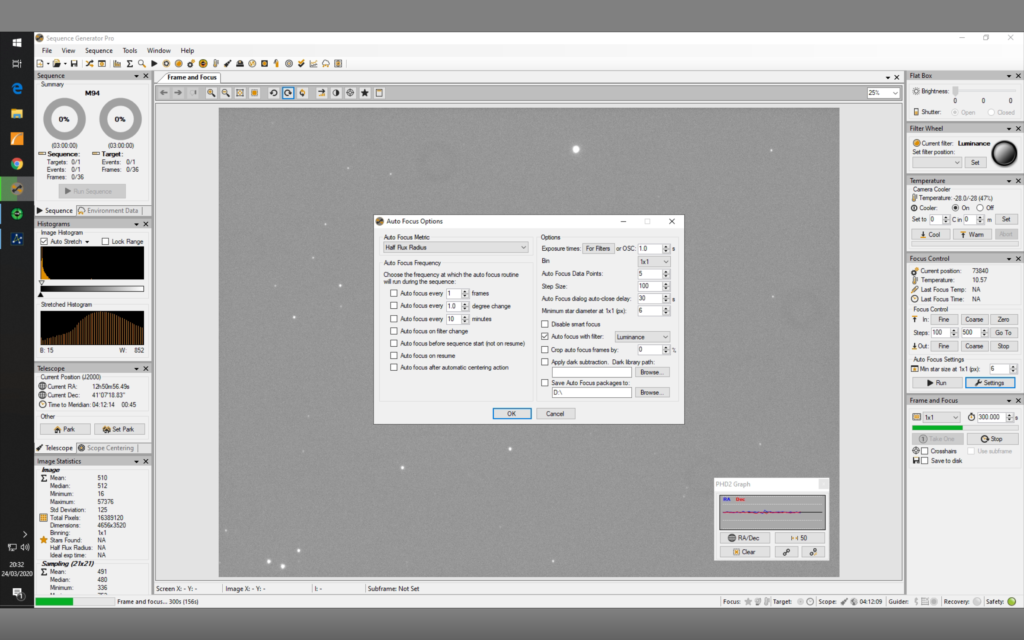
I slewed to nearby star and focused using SGPro after changing a couple of settings in the step size and amount of data points to be used, I set step size to 100 from previous 1000 and data point to 5 from previous 10 and got a much better focus. Focus landed up first time around at 738840
SGPro Autofocus settings changed
I had tried to get @focus working in TSX but it would fail every time on the galaxy with not enough stars. This meant I could not use TSX to solve and sync to centre M94.
SGPro autofocus
I then tried to centre with SGPro and that also failed so instead I used TSX to connect to the camera and manually moved M94 to the centre of the chip. I ned to get the local plate solver working as it was not running.
@ 20:32 I took an initial 5min sub to see what the image would be like after setting PHD2 guiding running.
5 min M94 sub
@1:20 and after gathering 3 hours of data I moved to other side of mount so meridian flip. I refocused as it had drifted a lot. I now need to consider setting up focus move for temp as the focus shift is dramatic. I also changed PHD2 Hysteresis setting to 0.20 from 0.10 as the PHD was having problems guiding.
I struggled to find guide star and landed up exposing for 15s and then having to increase, possibly needs recalibrating on this side of the mount. But also I need to find a brighter guide star by moving the mount offsetting the galaxy. The other way is using one of the piggy backed scopes which I may do next time.
@1:43 the dome closed, not sure why, might have been high cloud but probably because the WSX software lost contact with the WSX hardware. I did a reset and reconnected and then it was fine, but as the dome had closed I packed up with 3 hours of Luminance data on M94. I now need to take flats on the morning.
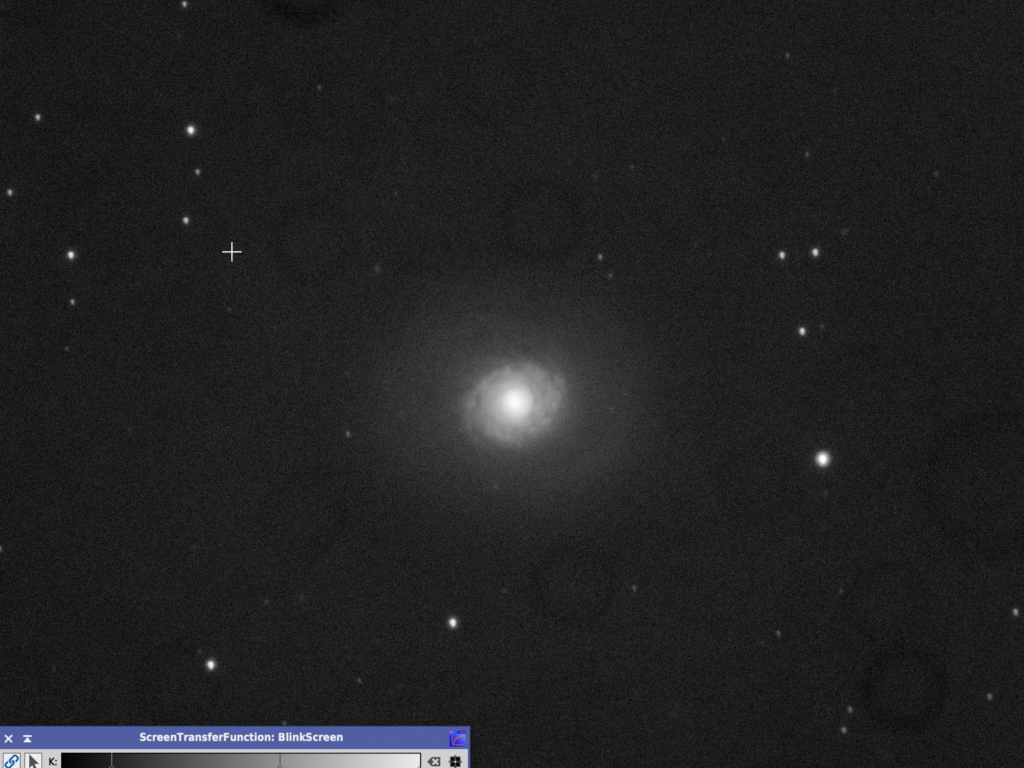
Single 5 min sub stretched in PI
Learning’s for next time……….
Update the SGPro Equipment profile with the changes for step size and data points for autofocus
Make sure the local plate solver is working and online at localhost
Review Anydesk bug that changes mapping of keyboard
Check out why WSX is loosing connection and shutting the dome
Work out how to use temperature compensation for the focuser in SGPro
Flats from the following day at the same focus point