On January 15th 2022 at 15:10 AEDT (04:10 GMT) the Hunga Tonga Hunga Ha’apai underwater volcano near Tonga erupted. Hunga Tonga-Hunga Ha’apai is 1.8 kilometres tall and 20 kilometres wide, but most of it is underwater, with the top 100 metres visible above sea level. The pressure wave generated by the explosion blasted through the atmosphere at more than 1000 kilometres per hour.
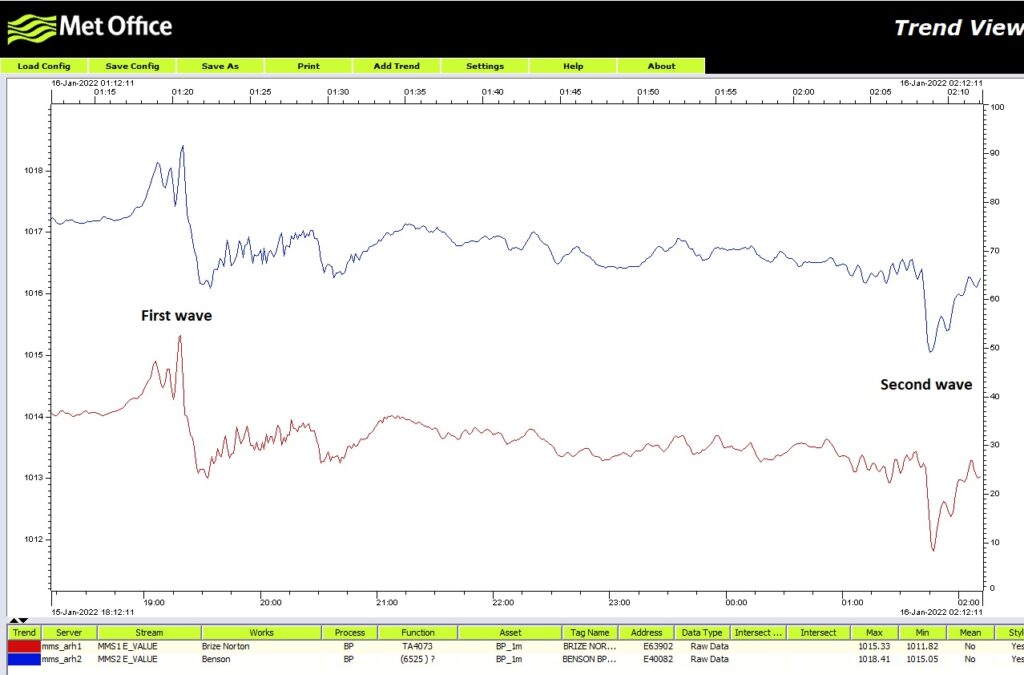
Dave mentioned to me that the people had registered a pressure increase on their monitoring devices due to the pressure wave and checking the internet the Met Office has issued a nice graph on Twitter.
On the observatory Grafana dashboard I could indeed see two pressure waves at the correct time. We only record the pressure every 60 seconds because for astronomy that’s all we need so we do not have the resolution of others but the height of the two events are in the correct range compared to the graph above.
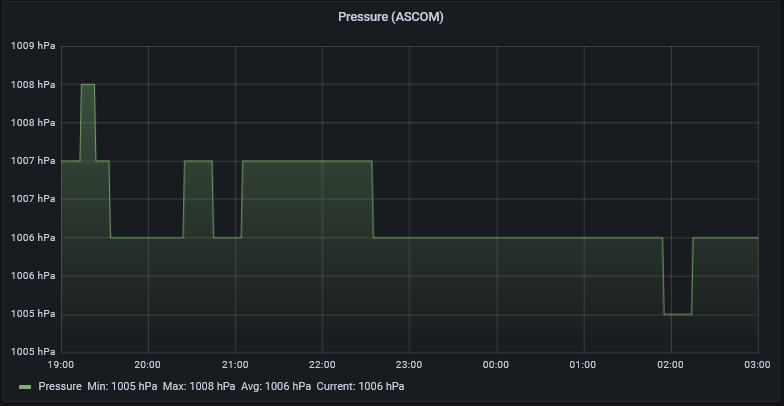
The first pressure wave arrived (19:13-19:24) we was 2hPa increase as we have lost some resolution due to sampling period and the Met Office is ~2.5 hPa. We could change the sampling to be lower (15 or 30 secs) as storage is not an issue and then we would have caught a nice defined peak. The second pressure wave (2022/1/16 01:55-2:14) and we measured ~1hPa drop and again was lower than the Met Office due to our sampling period.
Our auxiliary pressure monitoring install was down during this period as the box appeared to have been restarted/rebooted and the ASCOM Alpaca instance was not running which was unfortunate 🙁