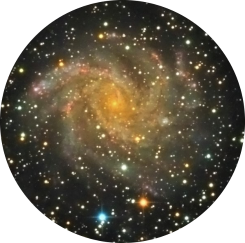
So after ages I’m planning to perform some imaging after being challenged by Dave to produce a OSC image of M31 with the QHY268C that can be of print quality.
The first step was upgrading all the necessary software to make sure both the NUC and laptop would not be interrupted during my planned imaging session.
Windows10 latest Updates (Dec2022)
SGPro (4.2.0936)
NINA (2.1 HF1 Beta002)
ASTAP (2022.12.09)
ASCOM (6.6SP1)
Pegasus Ultimate PowerBox (1.6.1230.46)
iOptron commander (5.9.0.2)
The iOptron CEM60 mount hadn’t been updated in ages and it showed :
HandControllerV2 : 210106
MainBoard : 190716
RA board : 201005
DEC board : 190716
After performing the firmware update procedure, the mount was now showing the following levels :
HandControllerV2 : 220119
MainBoard : 211018
RA board : 211018
DEC board : 211018
Catalog : 150429
Of course I will need to perform a new zero mount position following the upgrade. Tonight I will also be changing the OpenPHD algorithm to PredictivePEC as described by Cuiv the LazyGeek :
So it’s about time I tried to find a replacement for SGPro, given the continued problems with it, it’s less than intuitive design and find something that does not cause friction in my desire to capture more photons from the distant universe! So after looking at NINA briefly earlier this year, I have gone for it this evening to see if I can indeed capture some images.
The problem that set me back once before with NINA was the lack of connection to the FLI focuser. I just simply got an ASCOM error (I really dislike ASCOM). So after some educated guessing I got it connected. Instead of connecting to the FLI focuser directly I actually went through ASCOM which bizarrely cured the error.
With that done. I could now run autofocus, and only the 2nd time in my life this astronomy programme focused on the first go. The only other piece of software that good is the ZWO ASIAIR that I really enjoy because it just works.
I have now connected NINA to PHD2, also to TSX and left TSX to control the dome. I may change this later, however it works just fine and has not caused any problems. The only reason may be to further automate the dome for closing and reporting on status if that is a feature of NINA, something to look into later.
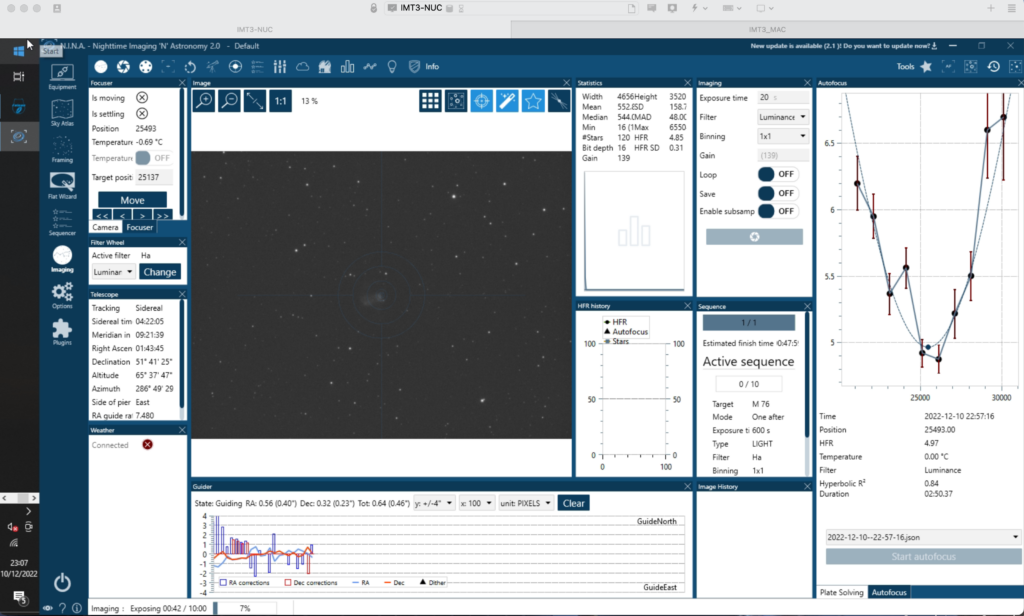
NINA at work
Managed to take 5 or 6 Ha images of 600s this evening before the cloud rolled in. I can use the flats from yesterday. A good evening testing given conditions including the almost full but waining Moon.
On January 15th 2022 at 15:10 AEDT (04:10 GMT) the Hunga Tonga Hunga Ha’apai underwater volcano near Tonga erupted. Hunga Tonga-Hunga Ha’apai is 1.8 kilometres tall and 20 kilometres wide, but most of it is underwater, with the top 100 metres visible above sea level. The pressure wave generated by the explosion blasted through the atmosphere at more than 1000 kilometres per hour.
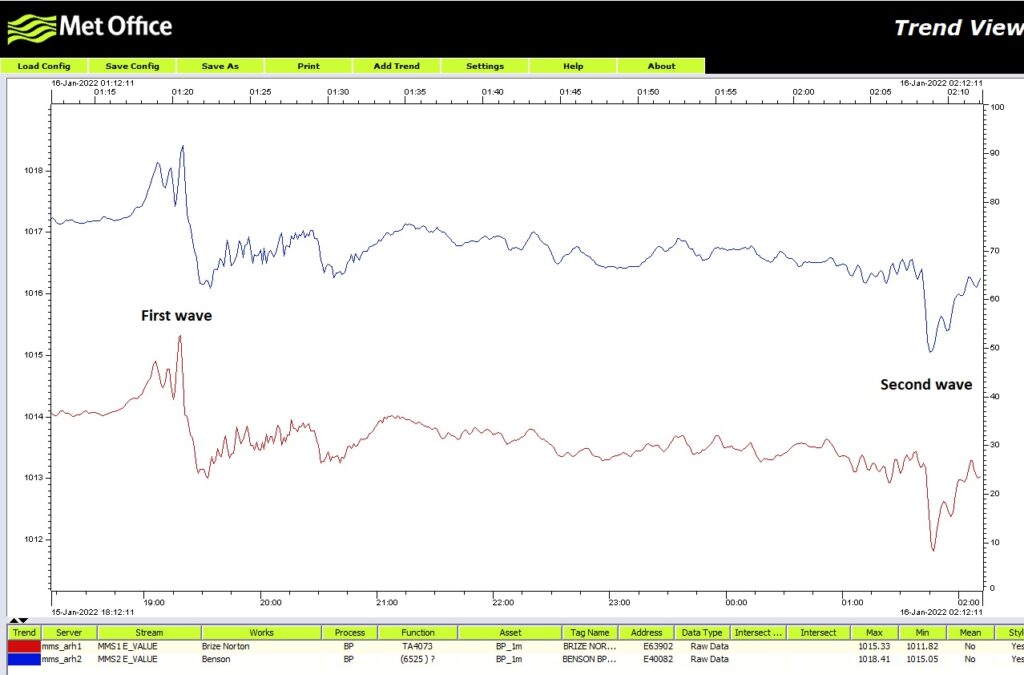
Dave mentioned to me that the people had registered a pressure increase on their monitoring devices due to the pressure wave and checking the internet the Met Office has issued a nice graph on Twitter.
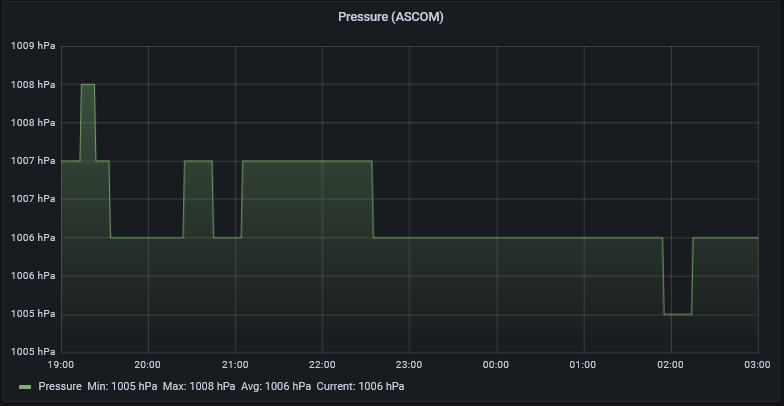
On the observatory Grafana dashboard I could indeed see two pressure waves at the correct time. We only record the pressure every 60 seconds because for astronomy that’s all we need so we do not have the resolution of others but the height of the two events are in the correct range compared to the graph above.
Double pressure wave
The first pressure wave arrived (19:13-19:24) we was 2hPa increase as we have lost some resolution due to sampling period and the Met Office is ~2.5 hPa. We could change the sampling to be lower (15 or 30 secs) as storage is not an issue and then we would have caught a nice defined peak. The second pressure wave (2022/1/16 01:55-2:14) and we measured ~1hPa drop and again was lower than the Met Office due to our sampling period.
Our auxiliary pressure monitoring install was down during this period as the box appeared to have been restarted/rebooted and the ASCOM Alpaca instance was not running which was unfortunate 🙁
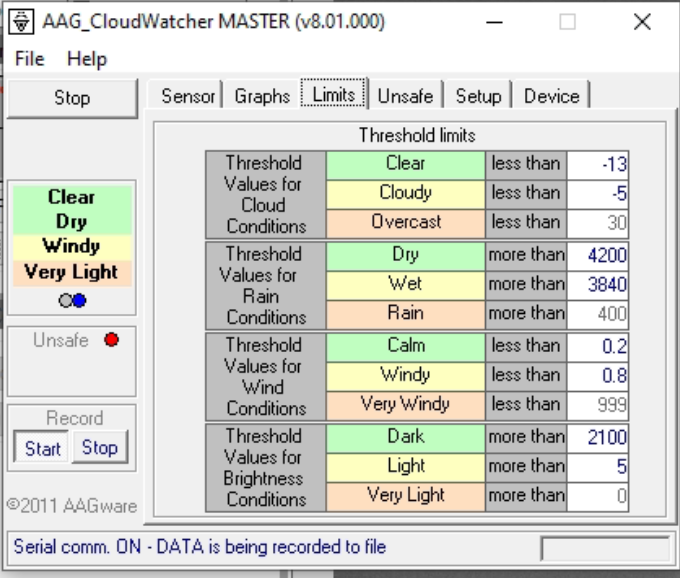
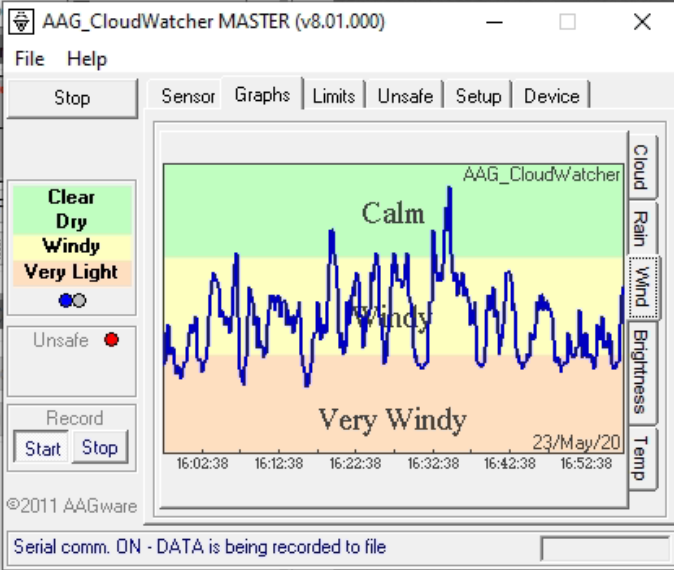
Today has been wet, windy and cloudy, which for once is a blessing! Why I hear you ask? Well simply put, to calibrate the hell out of the AAG one needs inclement weather and today has provided that in spades 🙂
So after monitoring the AAG all day here are the final settings. I have changed the limits for the wind only today, but I have extended the time period for the graph from 10mins to 1 hour. The wind has recorded over 1.1 m/s which may not seem a lot but at times has blown garden furniture around and the bins.
We recently decided to replace our existing weather station with one that had better ASCOM integration. I had previously looked at the AAG CloudWatcher but at the time felt it offered more than we need but that turned out to not be the correct choice.
We ordered the AAG with an internal humidity sensor, the optional anemometer, mounting kit and 10 meter communications cable. Due to the ongoing human malware situation it took two weeks for it to arrive from Spain and was delivered to the IMT3 chief TOSA.
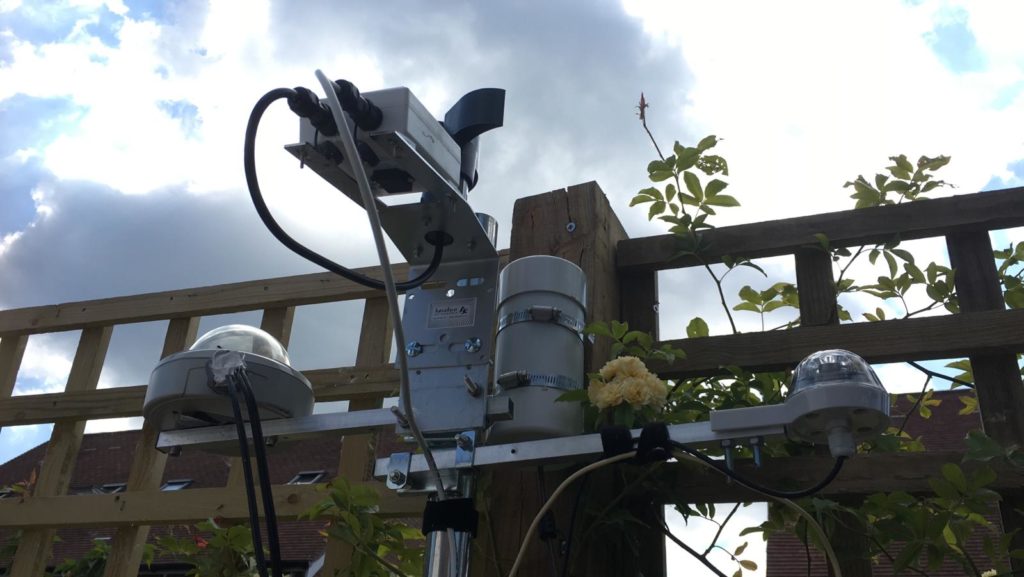
Once the new PSU arrived the Chief TOSA then set about removing the existing weather station and installing the AAG cloudwatcher.
All Sky Camera, AAG CloudWatcher, Unihedron SQM and another rain sensor
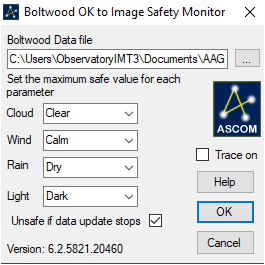
This also meant connecting the safety relay circuit wires to the Pulsar Dome, installing the AAG software, downloading the ASCOM boltwood driver and configuring SGPro. Within SGPro we have set the safety status set to be “OK to image” where the required conditions are more stringent than the conditions for the dome to open. The reason being that we want the dome to open as the light begins fade and allow the scopes to cool down but not be okay to image until it is dark.
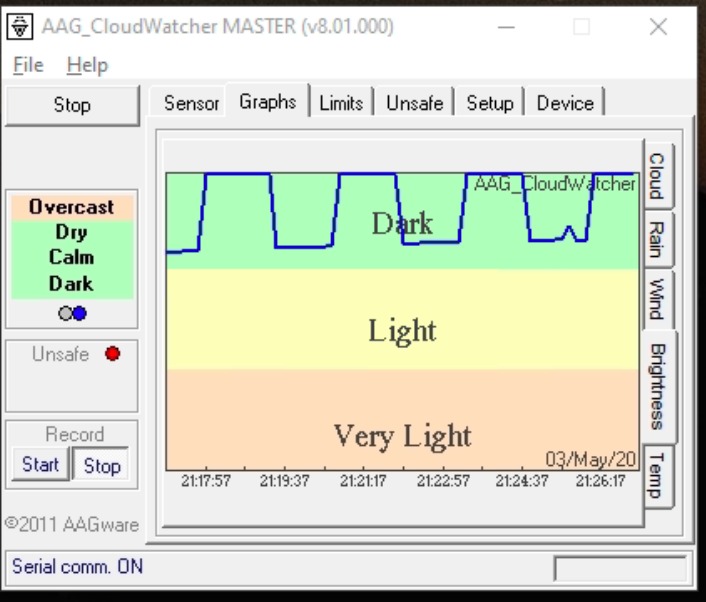
On the first night of operation we ran into a problem. Unlike the other sensor readings and graphs we would see the temperature and cloud readings have an expected shape but the sky brightness sensors kept going up and down at a regular interval then gave the graph a saw-tooth shape.
Unfortunately this resulted in the safety status going on and off until we overrode it. We sent a quick email to Lunatico reporting the symptoms and asking for advice. It didn’t take long for Jaime to reply informing us that another customer reported the same issue and asked for a few days to investigate.
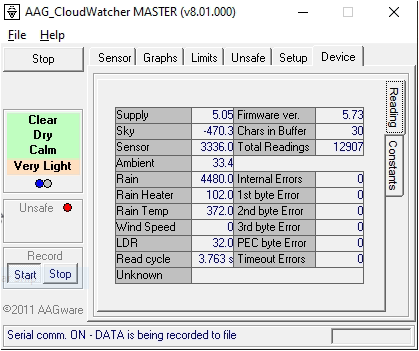
Good to his word we received an email from Jaime explaining the issue and asking if we could perform a firmware upgrade. Now due to the current lockdown restrictions this meant that I had to co-ordinate over the phone with the resident Chief TOSA to physically disconnect and reconnect the power whilst I remotely set the firmware update. The initial issues encountered were due to PEBCAK (Problem Exists Between Chair And Keyboard) as I had not read the documentation correctly !
New Firmware 5.73 loaded
That evening we watched and the Sky Brightness line graph was now as expected and not looking like a cog shaped wheel. Well done Jaime@Lunatico.es for the quick response and fix, Chief TOSA was a happy dome dwarf again and that’s what counts !
At the moment we are trying to get the cloud sensor to be more accurate to what we visually observe, this is an ongoing effort. We decided to record the AAG Sky Brightness sensor readings at various times and compare with our SQM readings :
Event
SQM
AAG Brightness Value
Civil Darkness
13.08
949
Chief TOSA setting OK to open
13.89
2100
Nautical Darkness
18.92
28588
Astronomical Darkness
19.03
28588
Using the above values it looks like we could reduce our chosen threshold level of 2100 to 1000 in order to allow the dome to open and the scopes to cool down. The Sky Brightness does not appear to change beyond Nautical Darkness. We are now investigating the correct value for the early morning from the AAG logs. This is so we know what the Sky Brightness value should be at which to stop imaging and close the dome in the early morning when unattended.
We still have at lot to configure and read up about using the AAG CloudWatcher but at the moment our initial experience is a positive one. Obviously we will be chatting to Lunatico about our level settings and make some suggestions regarding the software.
During one of our video sessions whilst watching the T-point run, Chief TOSA Dave mentioned about how it would be nice to see status information of observatory operations in a simple web page.
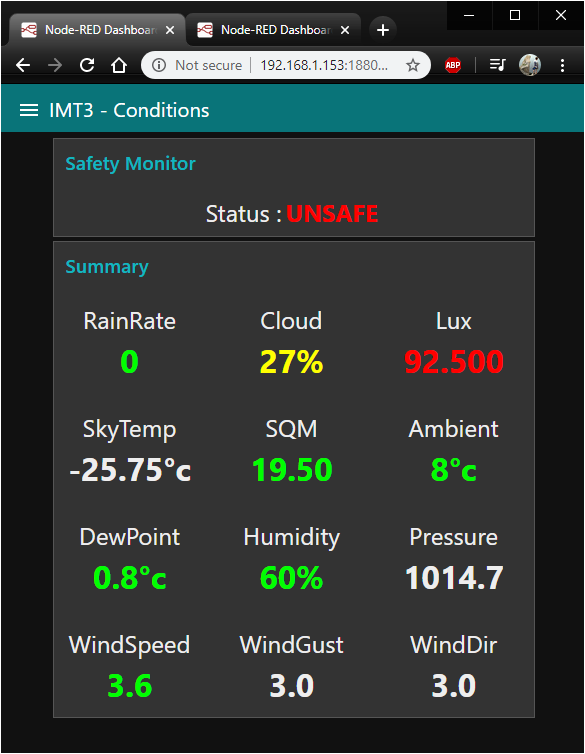
Since I’d never used Node-Red but had used ASCOM Alpaca via Python I thought this may be the time to learn something new. As I was designing this for Dave I decided to keep the layout, presentation simple along with colour coding in the spirit of Fisher Price toys.
The safety monitor is always visible across all tabs, the colour changes depending on the threshold levels we decide on.
ASCOM Alpaca Weather Conditions
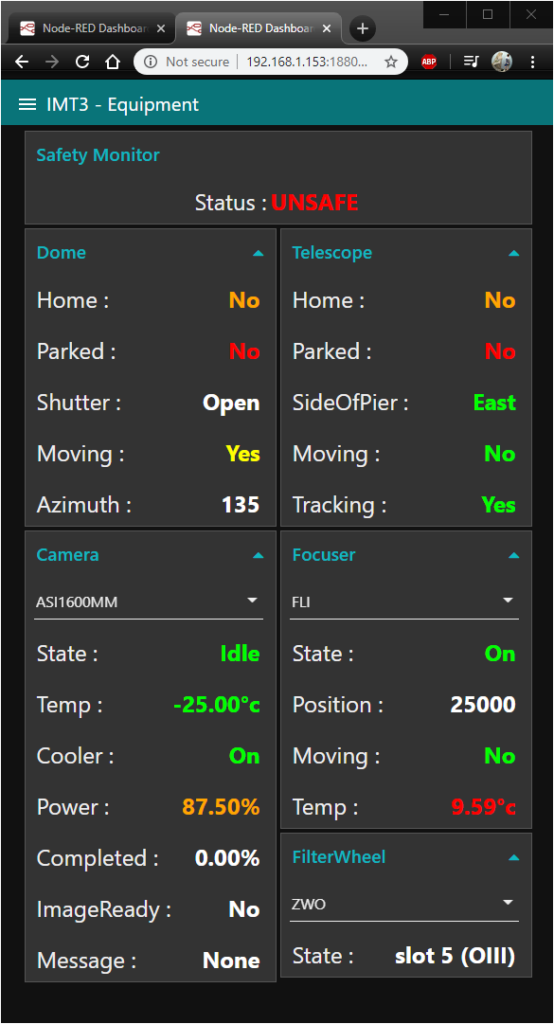
Likewise the main equipment tab displays the equipment status and allows us to select which camera, focuser or filter wheel to monitor.
ASCOM Equipment Status
This project is still very much a work in progress but there is many different ways that the same thing can be accomplished.