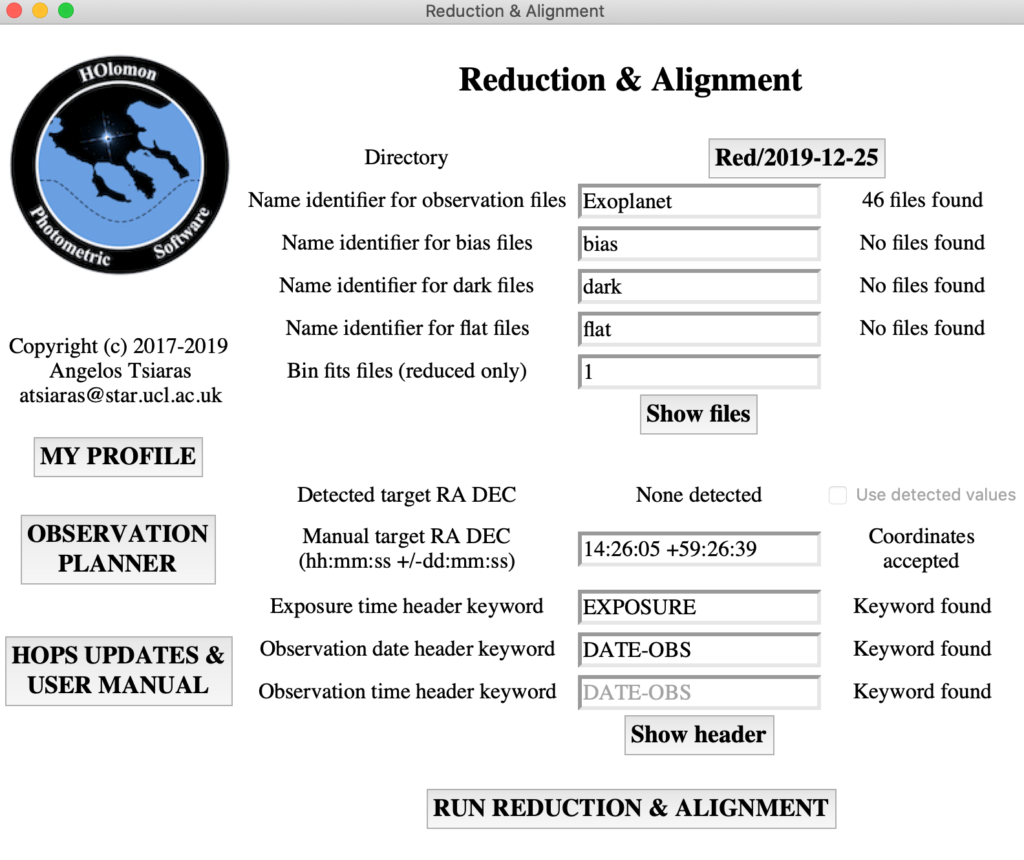
I managed to get only 45 minutes worth of data the other night to test if I could both acquire data and then process it. It took some time to get the downloaded HOPS software from the ExoClock mission working on my Mac, but with the help of Angelos from the project. So I opened the 46 images, I did not capture darks or flats and of course no bias due to it being a CMOS camera. I added information about the observatory and then ran the reduction and alignment code.
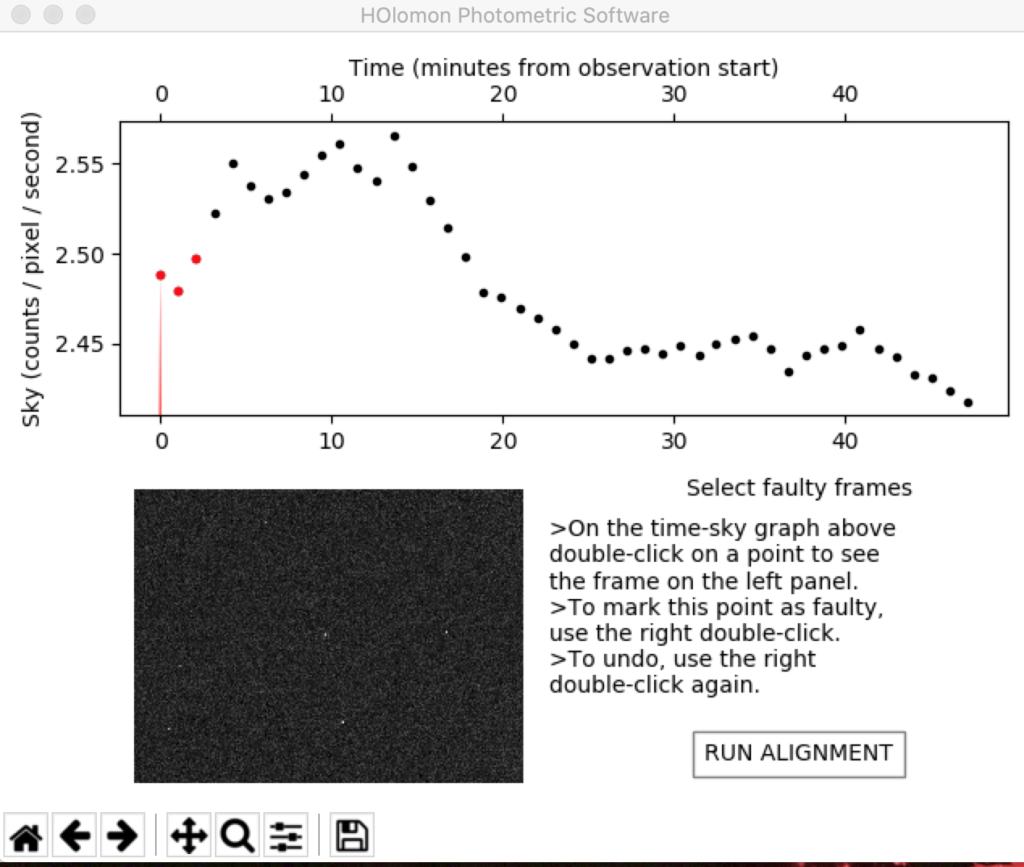
So the initial chart looked promising, I had taken the first set of frames almost on time for the transit even though you are supposed to start 1 hour before. This was because it took me so long to setup. So the data looks like it shows a decrease in brightness over the 45mins, however I have asked Angelos for his opinion and await a response.
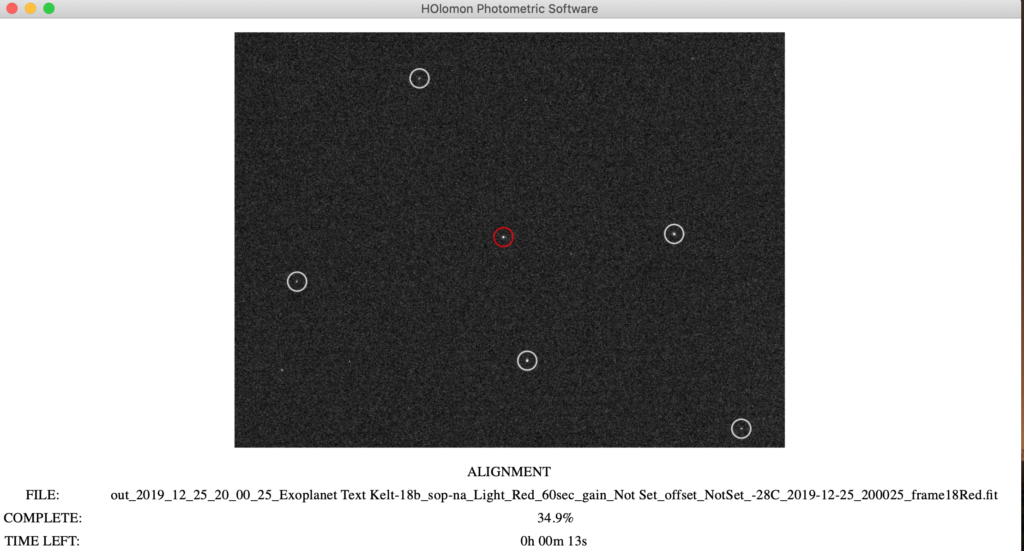
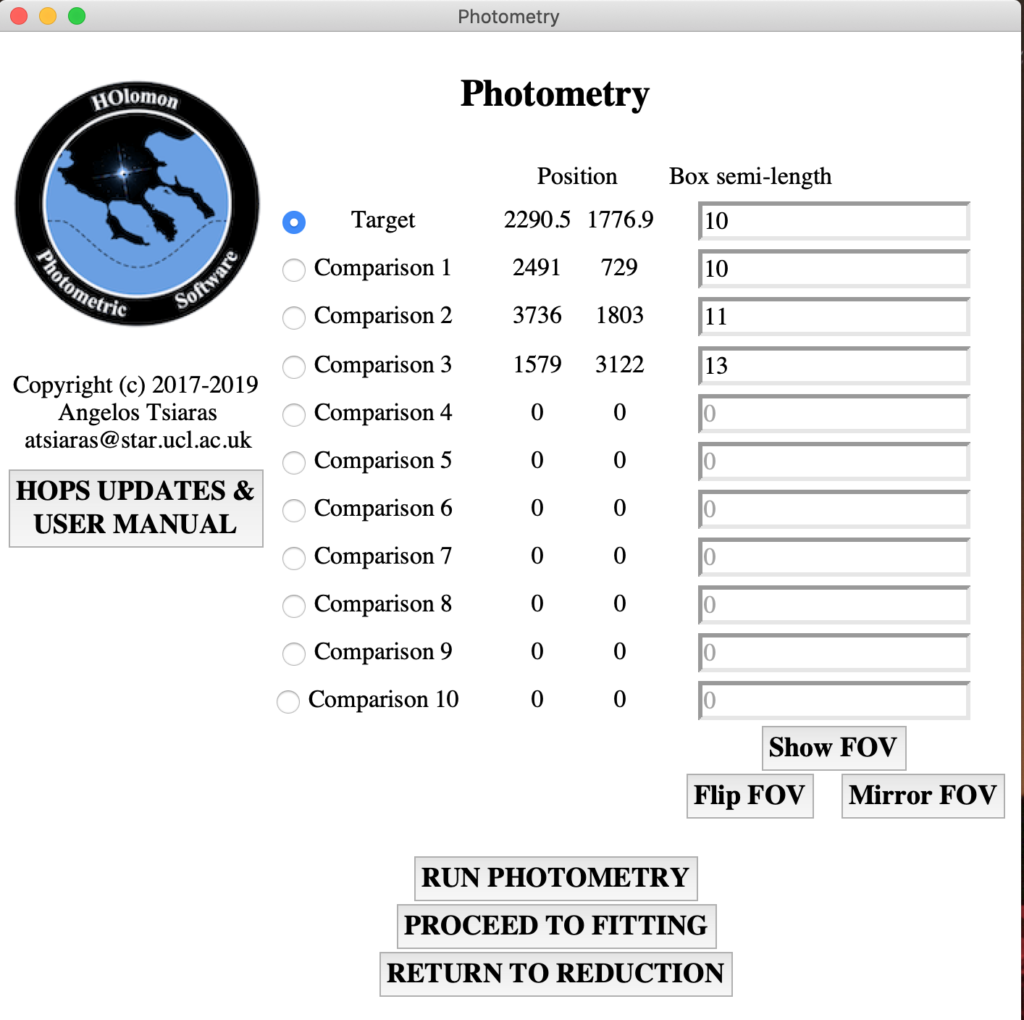
I then selected the target star, KELT-18 with the red circle below, along with 5 comparison stars. I may have selected stars incorrectly here as they are probably suppose to be not variable.
The resulting table appeared with the size of the box for each star and its position.
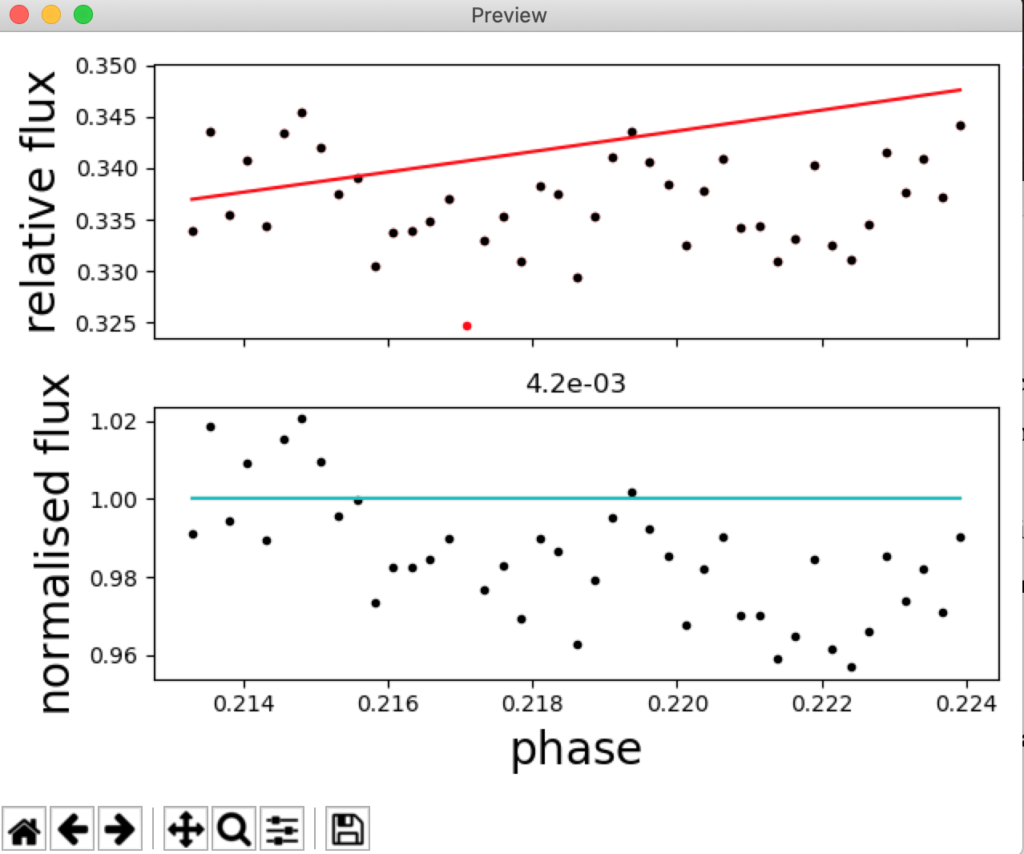
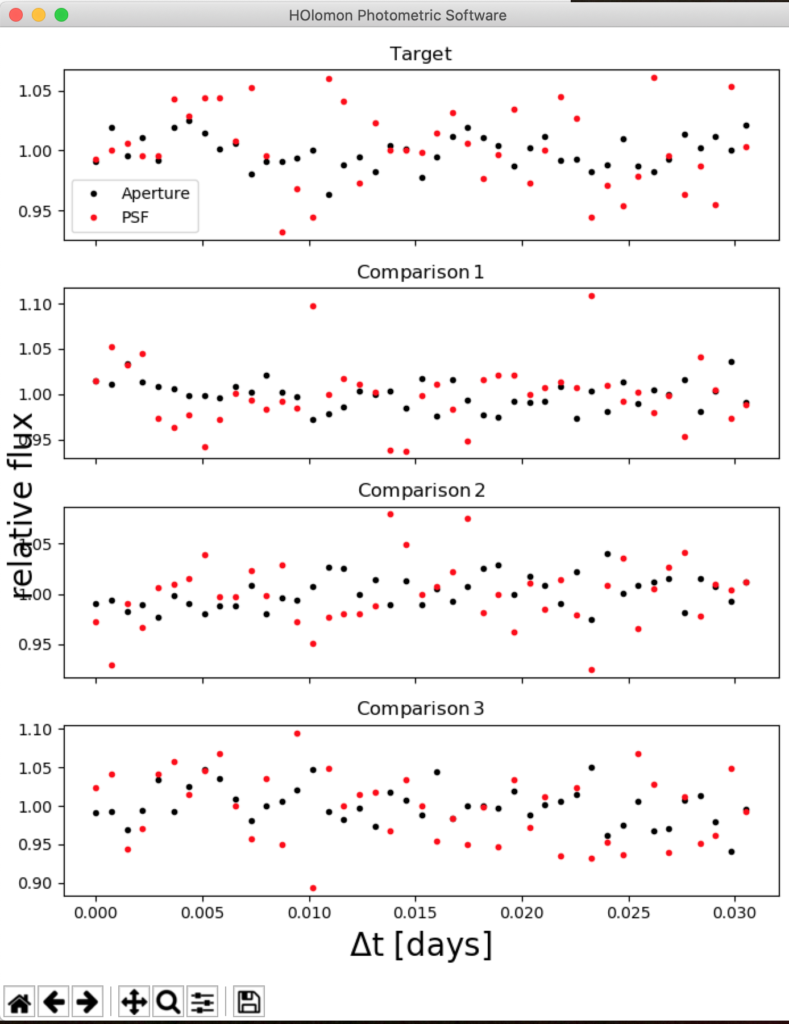
I then ran the photometry code and the following chart was created which to me showed I had done something wrong given the scatter.
I then for fun ran the fitting code from this screen.
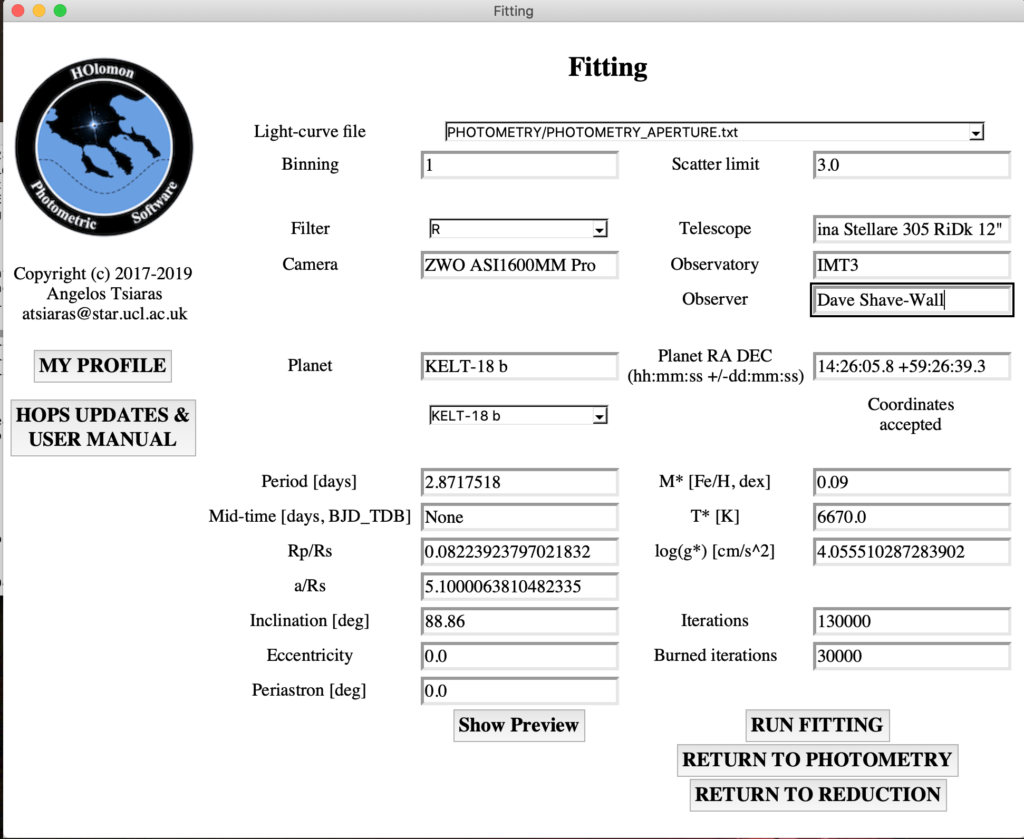
The fitting showed and increase in brightness which was clearly incorrect. So I have learned a few things with this, first is to read up on using the software for analysis, second is to gain more data and calibration frames.