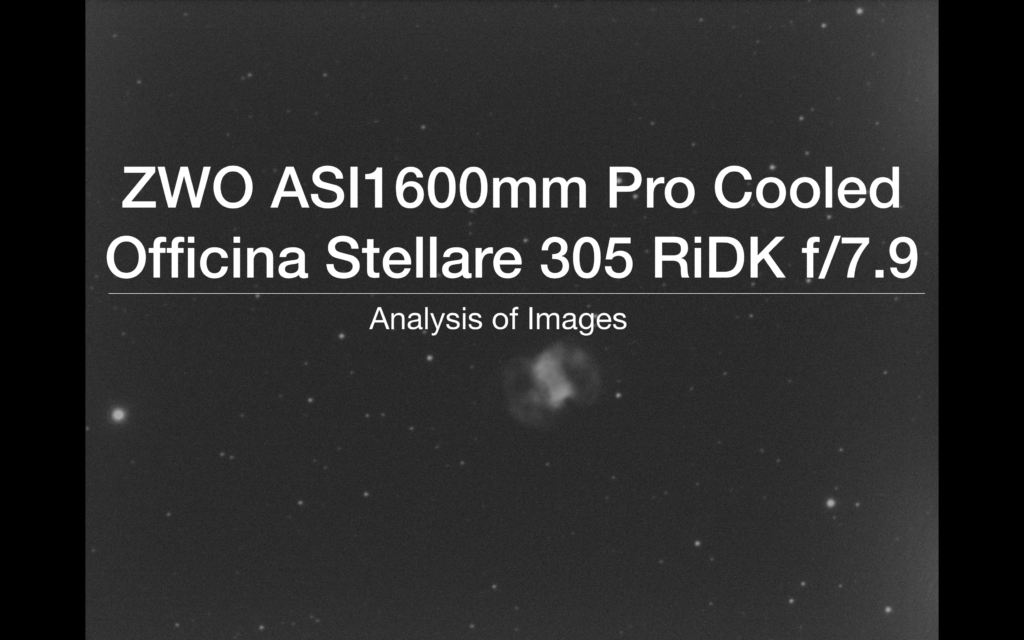
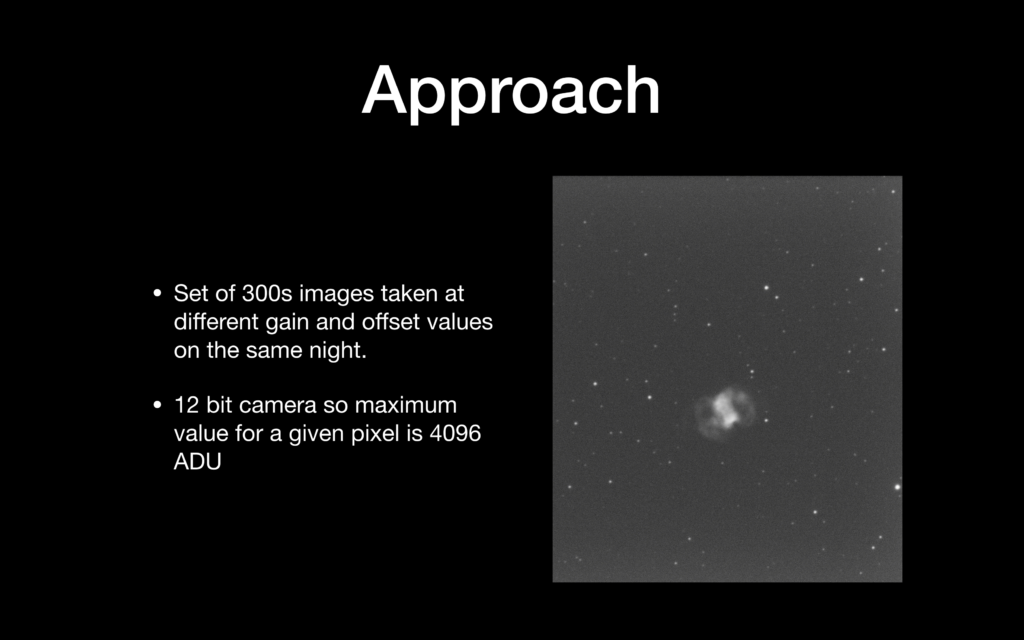
So the main approach here was to start testing the ZWO ASI1600mm on 5min images and decide which is the best Gain and Offset to use. As the object is a planetary nebula I have used my Astrodon 5nm OIII filter to bring out the faintest parts of the nebula. To be thorough, and this will take time, I plan on running the tests for all 7 filters I have.
I have done extensive reading on the topic of image analysis and hope to apply here what I have learnt. Given then camera is running 12 bit, I have a maximum pixel value of 4096 which represents saturation and then any further response is non-linear. Once I have completed 5min testing I will try for 10, 15 and 20 mins. I will then perform further testing by taking a sample set of 10 images to stack and see how that compares with similar total exposure times across the frames.
Amp glow is a particular problem with CMOS. Despite the ZWO site suggesting that amp glow is virtually removed in the Pro Cooled camera, it is clearly not, as can be seen in single 5 min subs. The good thing is a dark will remove it effectively. What I need to make sure is that the amount glow does not swamp the image so much that it overpowers the signal from the faint nebula.
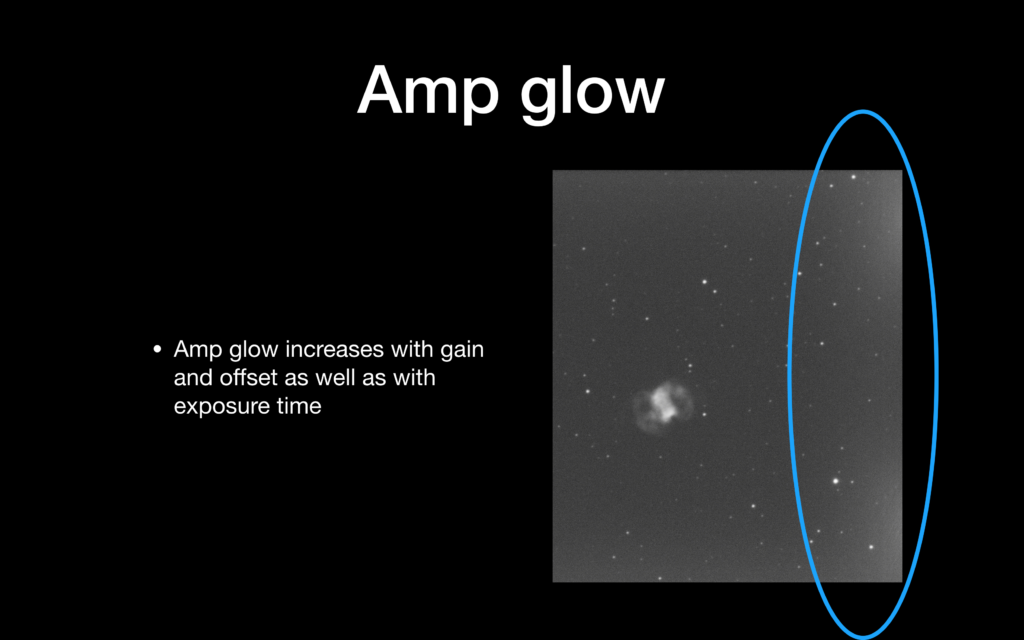
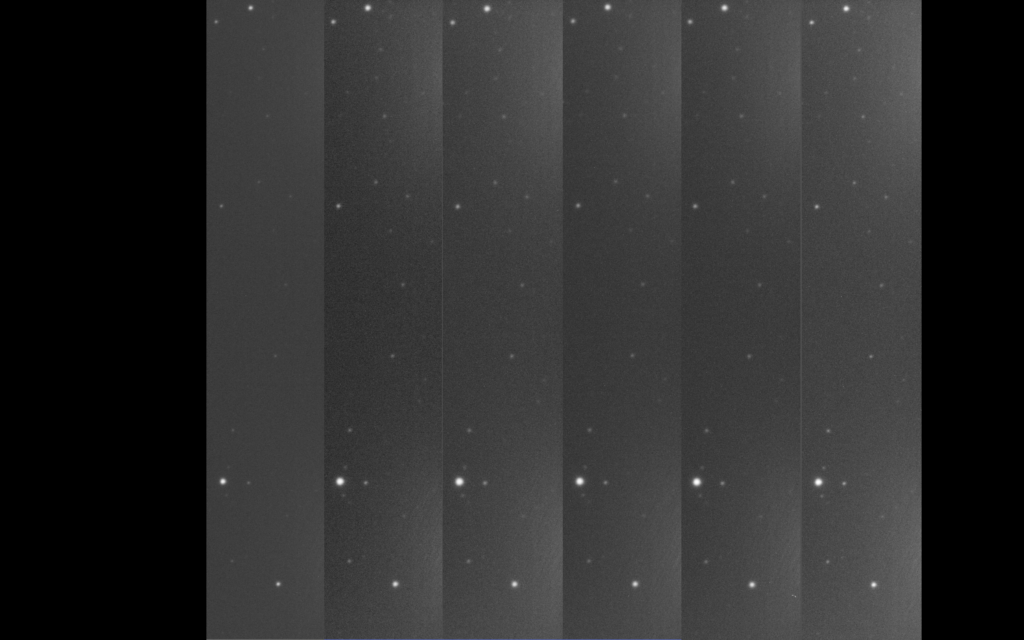
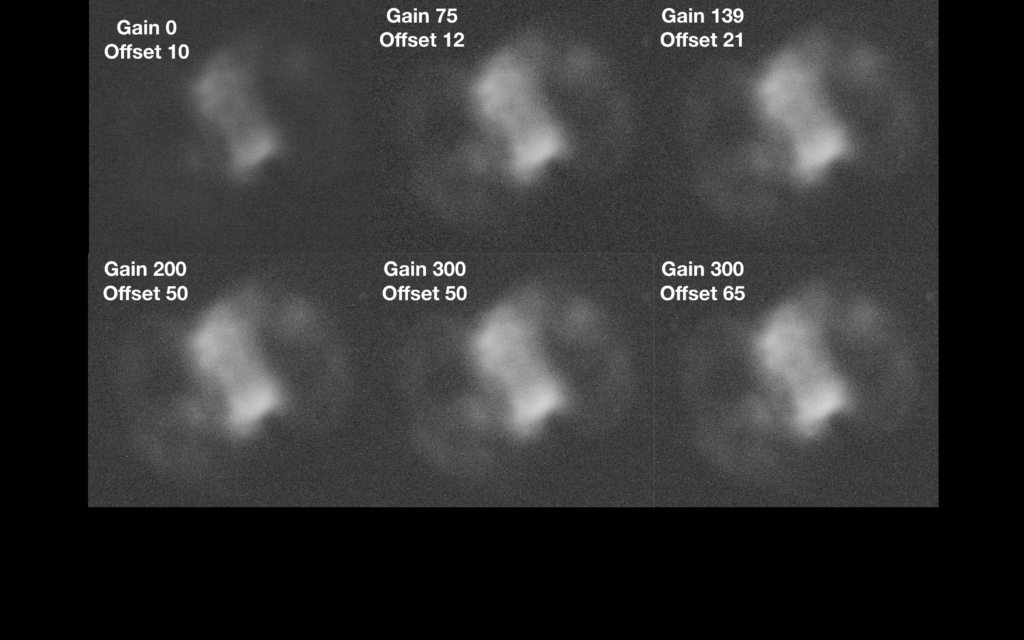
Increasing the gain and offset value from left to right you can see a marked increase in the amp glow. The image slices below are taken from the far right of each frame.
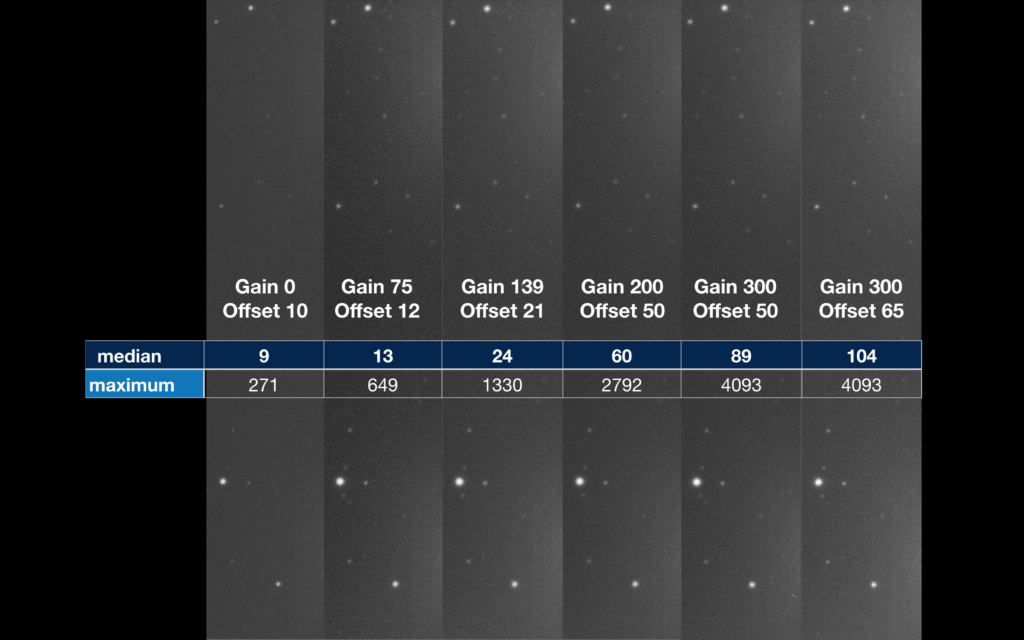
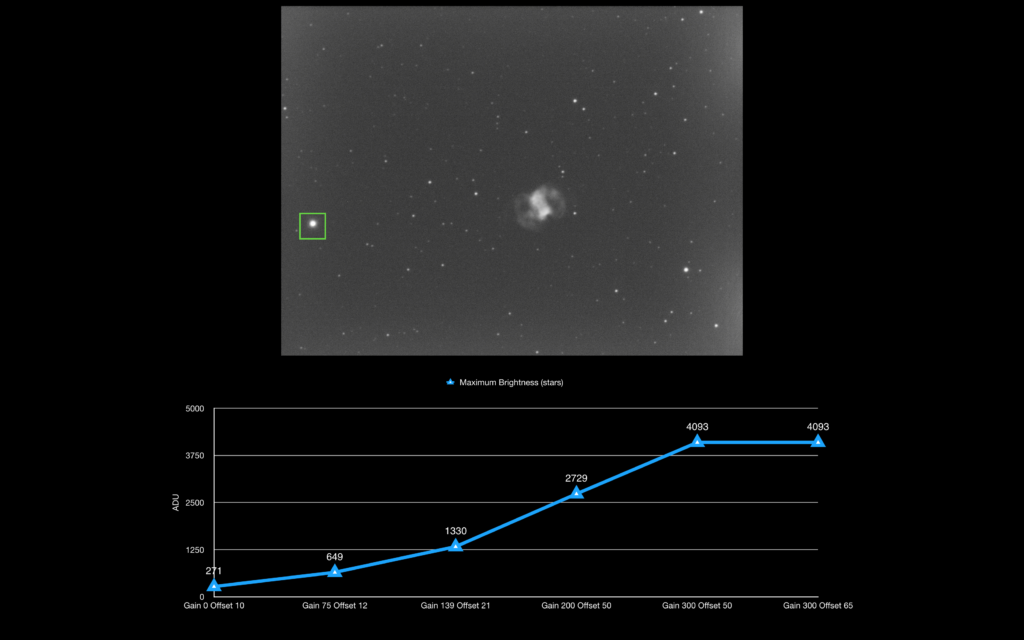
The offset figures in relation to the gain figures have been taken from my reading of various material. The median values are that of the background and the maximum values that of the stars. You can see on this 5min exposure that by the time I reached a gain of 300 one or more of the stars are saturated. In fact the brightest star in this slice is SAO 22510 which is mag 9.53.
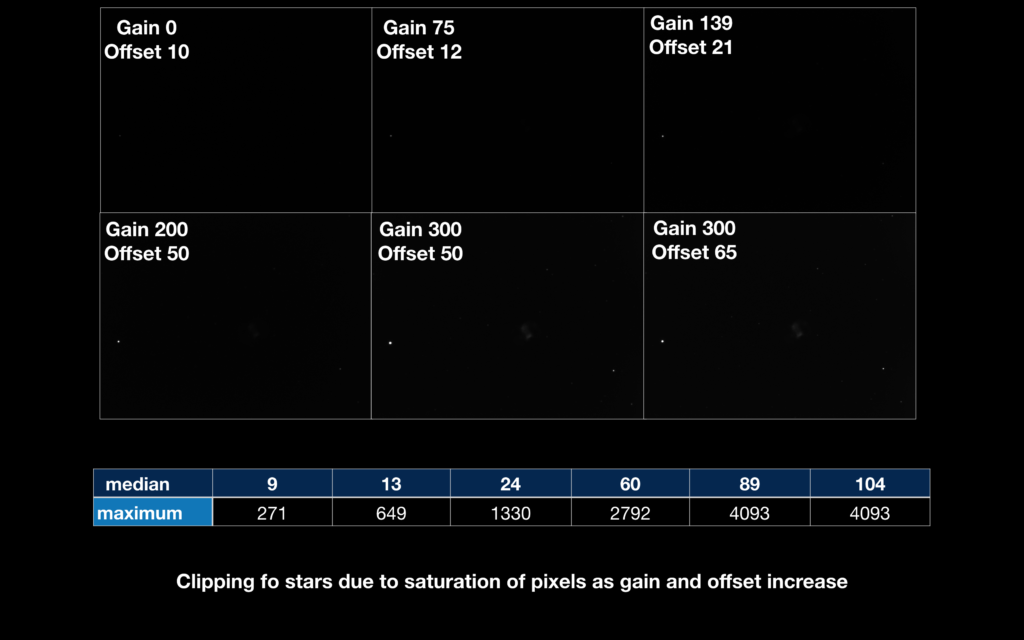
Another way to visualise the saturation effect is looking at the raw unstretched image, whilst a star is visible in the image using gain 139 and 200, on close inspection within PI and looking at the values of the pixels of the star they are not saturated. However gain 300 is. The purpose of this is that an unstretched image is not the defect for telling if parts of the image are saturated as some texts describe, but one can see the increased brightening of the star by gain 300 to know it is a problem.
So whilst I have seen the clipping a a few stars at the highest gain I have tested, what about the planetary nebula itself? From the below stretched image one could assume that the brightest part of the nebula was fairly bright and heading towards saturation, but don’t be fooled! Also there is a noticeable increase in the background brightness as the gain increases.
Again as for the amp glow, the aim is to balance the ability to amplify the faintest parts of the nebula without swamping them with the background brightness.
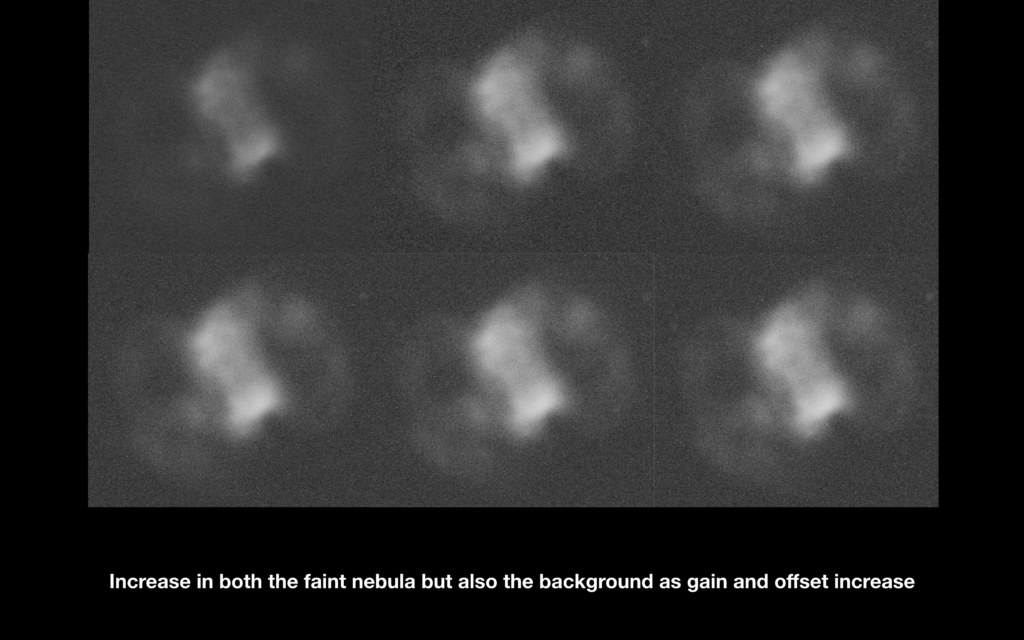
Again here are the values of the settings for gain and offset against the central section of the image.
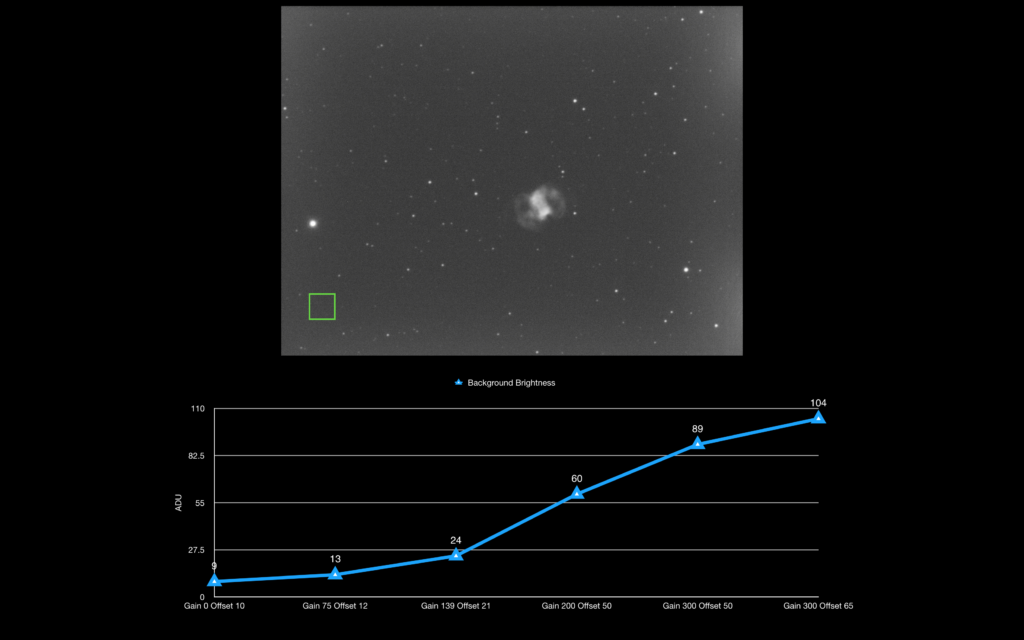
So how bright did the background get? The graph below shows a section of the background free from stars and charts the increase of brightness from a mean figure of 9 ADU with the gain set to 0 and a mean figure of 104 with the gain set to 300. So a large increase but but at least up until gain 200 not a problem, as we will see when we look at the faintest part of the nebula later.
This graph looks at the bright star SAO 22551 (HIP 8063) which is mag 6.66 and the brightest star in the image. Again as previously seen in the right hand slice of the image the star is saturated by gain 300. All figures are the maximum pixel values.
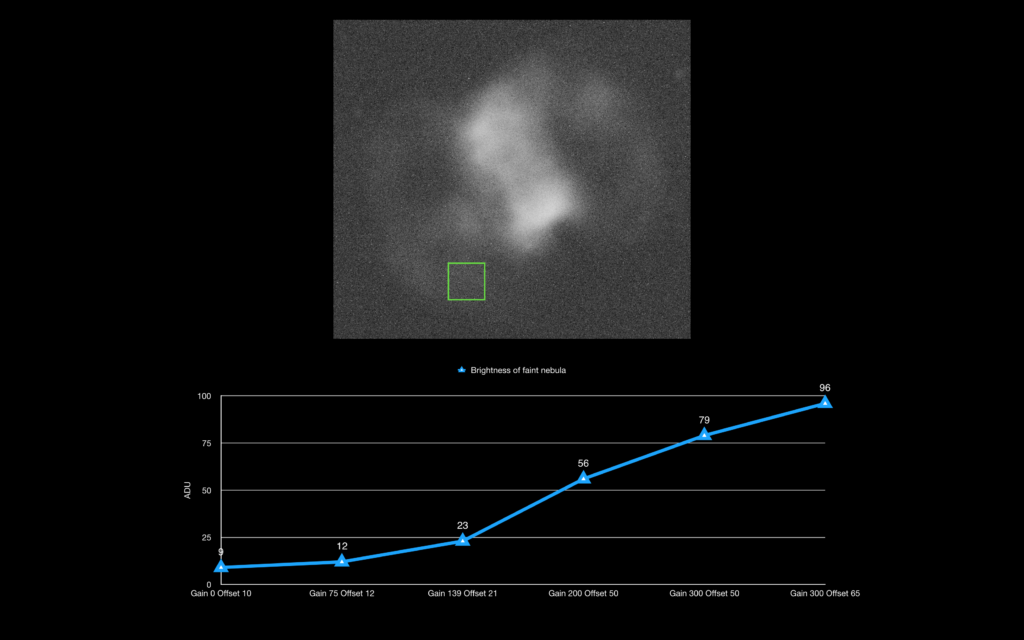
Now let’s focus on the nebula itself and go back to using the mean ADU figures. The picture below shows the section of the nebula I will use for analysis. In particular I focused in on the brightest lobe of the central portion of the planetary nebula and the faintest portion of the left arc.
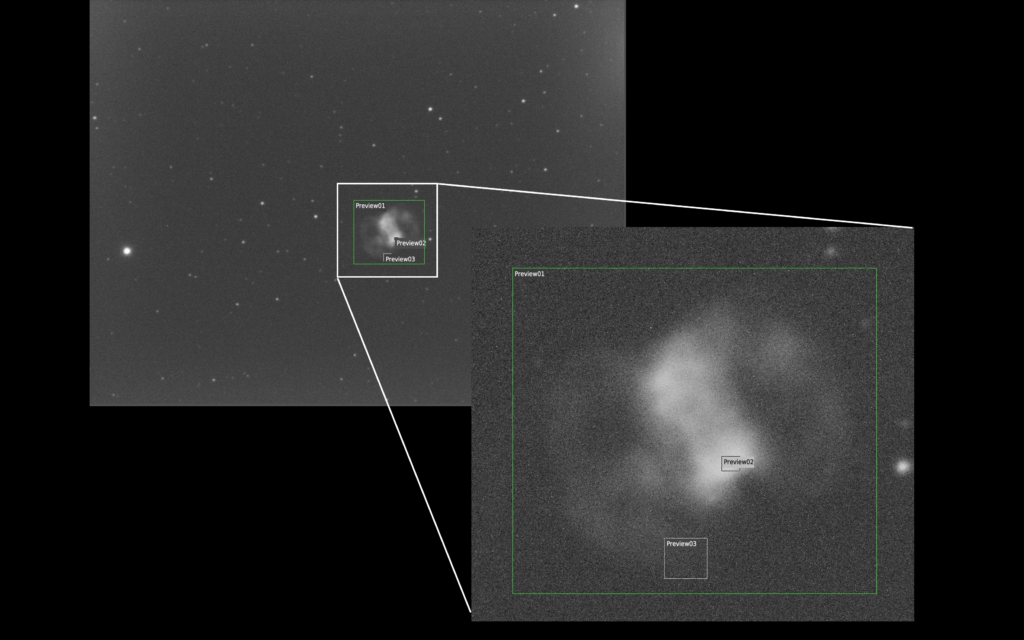
So looking at the faintest nebula within the left arc we can see that it is not very bright at all and the brightest it gets at gain 300 and offset 65 has a mean figure of 96 ADU. Each and every image at the different gain setting and offset setting is seemingly just below that of the background, which in itself is interesting as the nebula seems to be fainter than the background. So more analysis was needed.
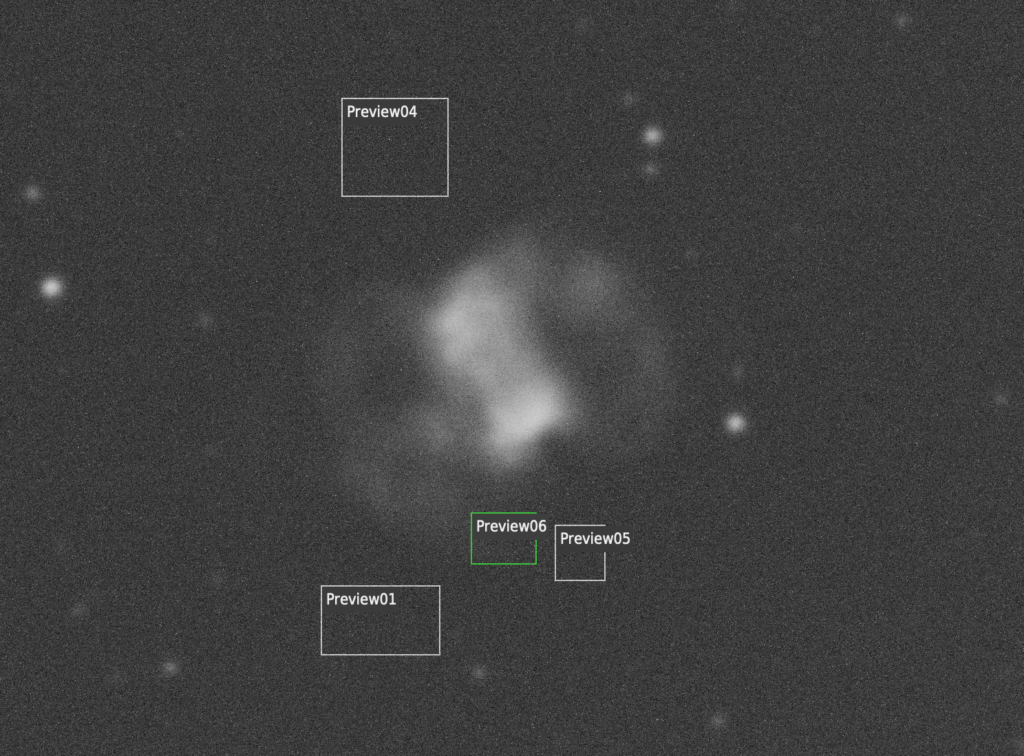
However I then went back and looked at a selection of areas of the background across the image to find that the original background selection to the bottom left of the image was brighter than other areas. Below you can see the image of gain 200 and offset 50, this time with 5 selection boxes. Preview 6 is the nebula as recorded before is mean 56 ADU. Preview 5, so the sky right next door to it has a mean figure of 55, so just below the nebula, hence it is only barely visible. Preview 1 is 54 ADU and Preview 4 is also 54 ADU. So there is brightening on that bottom left corner of the image, so had the nebula fallen at that spot then it would be swapped by the background.
There is only 1 ADU between the nebula and the background adjacent to it at gain 200 offset 50. If we looked at the same to regions in the image of gain 300 and offset 50 then you get a 2 ADU difference. The image with gain 300 and offset 65 gives a 3 ADU difference. So the results show that both gain and offset both help increase the contrast between the background sky and the faintest part of the nebula.
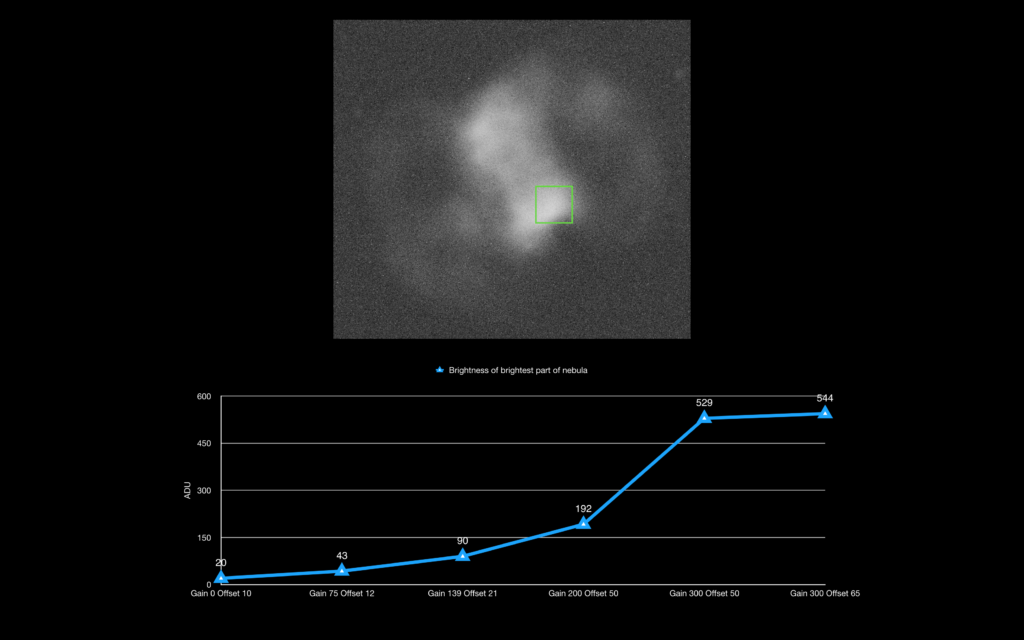
The final image below shows the brightest part of the nebula. At gain 300 and offset 65 you see a mean value of 544 ADU which compares to 96 ADU for the faintest part of the nebula and an adjacent background of 93 ADU.
The final piece of information pertains to the camera/chip specification and performance. The graphs below are from the ZWO website and clearly show as expected the more you increase the gain the read noise is lowered but unfortunately so is the full well maximum (the amount of electrons you can store in a pixel) and the lower the dynamic range, which for deep sky objects is a required.
So from this first piece of testing what have we learnt? Whilst there seems to be a good sense for increasing the gain and offset to help with the SNR especially between the background and the faintest part of the nebula, the increase in amp glow, decrease in dynamic range and reduction in the well count are all factors. Stacking as we will see, will undoubtably help the situation without necessarily setting a high gain. You can see why people say use Unity Gain, so the setting where 1 electron on the sensor = 1 ADU potentially gives the best result from a tradeoff point of view.
